Case study on breaking down female death loss
We do not expect the staff at the farm to be veterinarians, however, some training could help the crew be a little more specific on what the sows are dying from.
We are working with a large producer to analyze their female death loss. They have several farms with a total 36,000 females. Farms average in size from 1,000 to 7,000. They have had a history of health challenges on several of the farms over the last 12 months. Female death loss has averaged 10% over the last two years. The range in female death loss on the farms is from 6% to 15%. Female replacement rate averages 52% with the farm ranging from 42% to 64%. Entry to first service interval average 28 days with the farms ranging from 24 to 32 days. Pigs weaned per mated female per year averages 24 with the farms ranging from 22 to 30.
We broke the female death loss into three areas:
Entry to death interval (not served): These are gilts that have never been served.
Served to death interval (not farrowed): These are females that have been served but did not have a recorded farrowing event. They could have died in the farrowing room before farrowing started.
Farrowed to death interval (not served): These are females that farrowed but were never served before death. They may or may not have been weaned. We broke the death interval days into 10-day increments.
There were 8,999 deaths over the two-year period we analyzed. There were 29 death loss reasons recorded on the farms, several were different spelling of the same reasons. When we combined the same reasons together and combined the reasons with less than 60 deaths over to two years to the reason other, we ended up with 10 reasons to analyze.
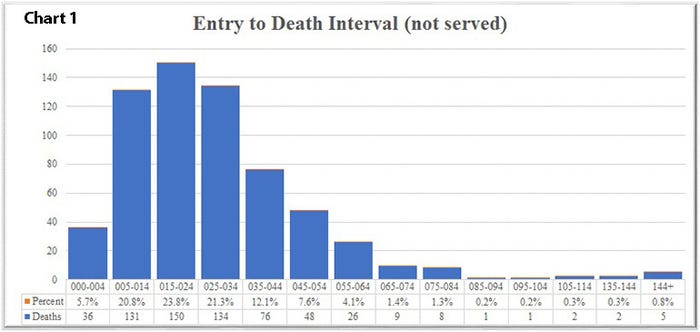
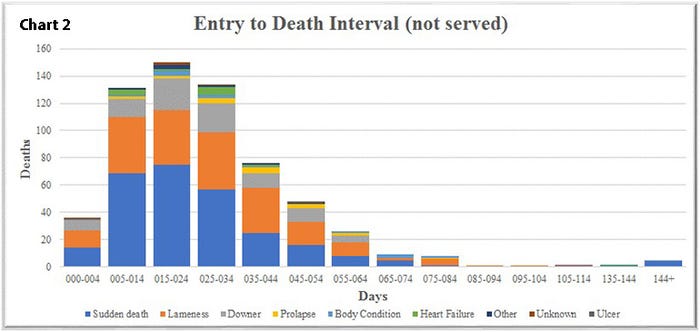
Entry to death interval (not served): There were 629 recorded gilts deaths. Chart 1 shows the breakdown by the number of days gilts were on the farm before deaths with 65.9% being five to 34 days after being entered in the sow records with five gilts being in farm 144-plus days before dying and not being bred. Chart 2 shows the breakdown by nine death reasons. The top three reasons were sudden deaths, lameness and downer.
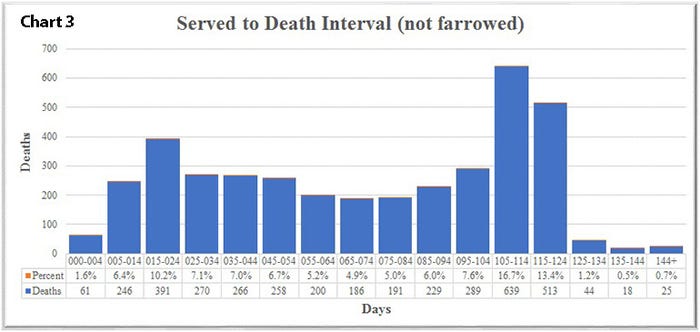
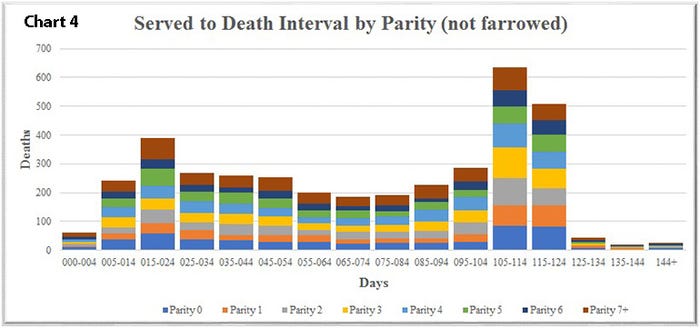
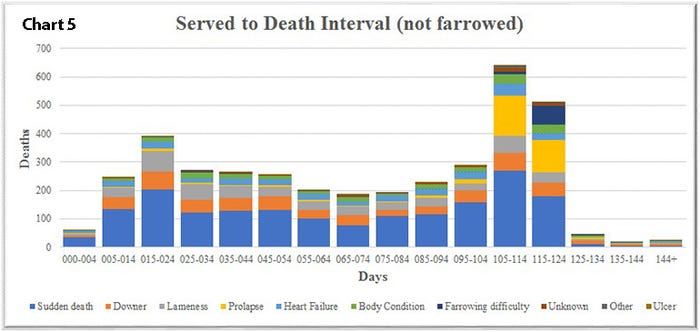
Served to death interval (not farrowed): Chart 3 shows the distribution of 3,826 females that were served (bred) and did not farrow. Day 000 would be day of breeding and 125-plus days would be females that went to term and did not farrow a litter. As you see there are a few extra bred females that die day 15-34 with days 105-114 at 16.7% and days 115-124 at 13.4%. That is the week before farrowing and the farrowing week. What parity females are dying? In Chart 4 each 10-day break down shows what parity died going from P0 to P7+. The days 105-124 account for 30.1% of deaths show when broke out by parity it involves all parities from P0 to P7+. When deaths are breaking down by the 10 reasons in Chart 5 sudden deaths, downer and lameness were the top three reasons. During the days 105-124 you will see a large number of the deaths are prolapses.
Farrowed to death interval by parity (not served): Chart 6 shows that 4,544 farrowed sows died after farrowing, during lactation or after weaning but were not served (rebred). Of those deaths 30.9% were days 00-04 after farrowing, with 24.2% days 05-15, and another 26.7% days 15-24. In a 24-day period when sows are in the farrowing a total of 81.8% of female deaths occur. Chart 7, which breaks the deaths down by parity, shows that all the parities are involved and the highest percentage being the older P7+ females. The reasons for these sows' deaths are the same 10 (Chart 8) with again day 00-04 most of the deaths being sudden death and the largest part being prolapses.
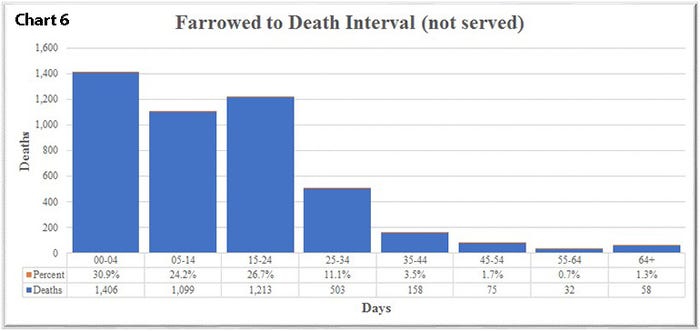
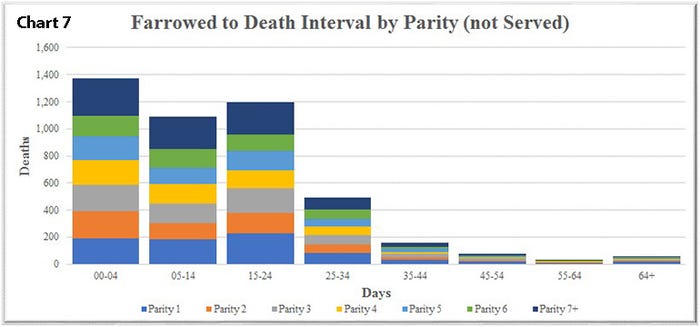
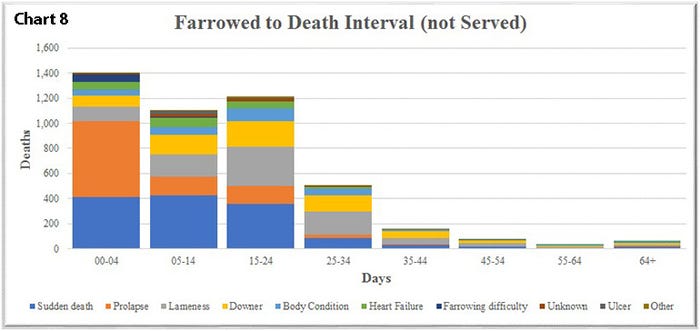
How does your farm record and analyze female deaths? Is your list for death very detailed and specific or do you need to add more information? At times when we have looked at female deaths, we see a large percent of the death as other, unknown, acute death, sudden deaths, etc. We do not expect the staff at the farm to be veterinarians however some training from your local veterinarian could help the crew be a little more specific on what the sows are dying from. By charting out each area we feel you can do a better job coming up with protocols and procedures to help lower female death loss. In Chart 3 and 6 you can see that a 20-day period from day 105 to 124 days after breeding and day 00-24 after farrowing are when most of the female deaths occur so more attention needs to be paid to females in that window of time.
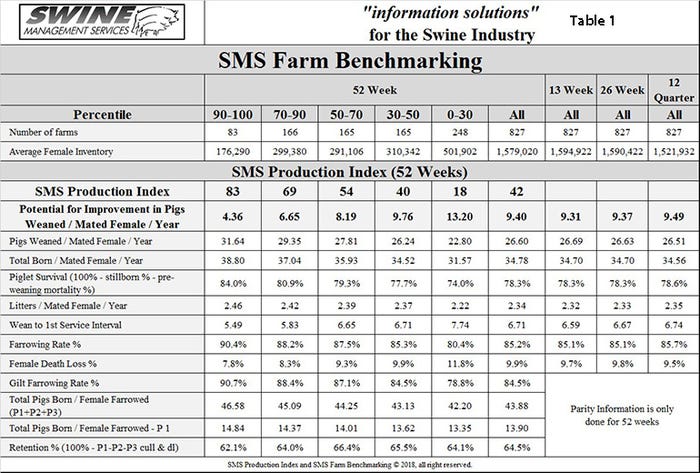
Table 1 provides the 52-week rolling averages for 11 production numbers represented in the SMS Production Index. The numbers are separated by 90-100%, the 70-90%, the 50-70%, the 30-50% and the 0-30% groups. We also included the 13-week, 26-week and 12-quarter averages. These numbers represent what we feel are the key production numbers to look at to evaluate the farm's performance.
At SMS, our mission statement is to provide "Information solutions for the swine industry." We feel with the creation of different SMS Benchmarking databases for all production areas we now have more detailed information to share with the swine industry. If your farm would like to be part of the SMS Benchmarking databases, or if you have suggestions on production areas to write articles about, please contact Mark Rix or Ron Ketchem. We enjoy being a part of the National Hog Farmer NHF Daily team. Previous columns can be found at NationalHogFarmer.com.
Sources: Ron Ketchem and Mark Rix, Swine Management Services LLC, who are solely responsible for the information provided, and wholly owns the information. Informa Business Media and all its subsidiaries are not responsible for any of the content contained in this information asset.
About the Author(s)
You May Also Like


