Subscribe to Our Newsletters
National Hog Farmer is the source for hog production, management and market news
For finishing closeouts to have less death loss, master the three core components of animal husbandry: feed, water and air.
October 11, 2023
By Bradley Eckberg, MetaFarms
Tough financial times are here in the pork industry with the producer’s bottom line in the red. It is unknown how much longer revenue will be greater than expenses so what can producers do to generate more revenue? Sure, diet formulations can be altered. And technology can be introduced to offset labor costs as well.
The good news is there is an opportunity for all pork producers to generate more revenue and it can happen today. The producer’s opportunity is increasing the number of pigs that generate revenue, also known as a high pig livability or lower death loss.
Finishing closed group analysis was performed utilizing the MetaFarms Ag Platform with specific focus on the U.S. customers only. In the calendar year 2022, the U.S. MetaFarms customers had slightly more than 13,000 closeouts with total pigs started of nearly 26,000,000. Characteristics of a typical finishing group consists of pigs that will be on feed for 115 days, consume five pounds of feed per day, average 50 pounds as a starting weight, and end weighing around 285 pounds.
It should be noted that the average size of a finishing closeout has not changed much over years. In 2018, the average finishing group had 1,873 pigs where in 2022, the average size group was 1,887 pigs.
Performance for the calendar year 2023 is based on finishing closeouts between Jan. 1 to Aug. 31, 2023.
Below, Chart 1, depicts the last five years of average finishing closeout mortality rates by year. As noted before, 2023 includes finishing closeouts between Jan. 1, 2023 to Aug. 31, 2023.Over this timespan, finishing closeouts have increased by 1.31% or 23.6% change.
To put that in perspective, in 2019, a 1,000 head finisher with a 4.25% mortality rate would lose 43 pigs over a 22-week period (154 days on feed) or 1.9 pigs per week. That same 1,000 head finisher in 2023 that averaged 5.56% mortality rate would lose 2.5 pigs per week.
I remembered back in 2020, when I wrote an article for the National Hog Farmer, which showed the impact on finishing mortality rates that increased due to COVID-19 shutdown of packing plants all over the United States. At that time, 2020 closeouts saw mortality rates jump by 0.37% from 2019, whereas 2019 saw an increase of only 0.03% from 2018. In fact, before 2020, the largest year-over-year increase in finishing mortality rates occurred from 2016 to 2017, where rates increased from 4.13% to 4.22% (0.09% or 2.2% change).
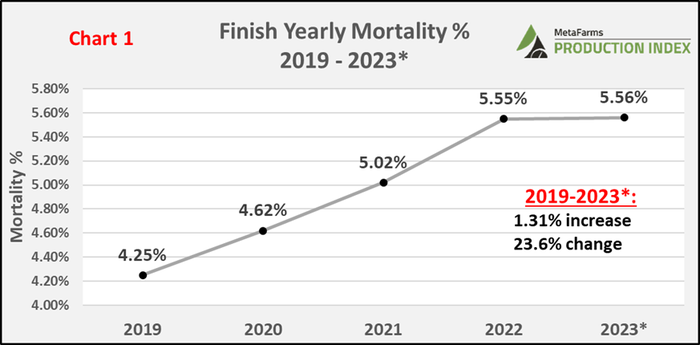
Chart 2 looks at the percentage of individual closeouts broken into three mortality range buckets. Groups closed out with less than a 3% average are identified in green, groups with an average rate between 3-10% are in grey, and those groups that closed out greater than 10% are identified in red.
The chart below depicts a couple of very telling and concerning trends in finishing closeouts. First and more noticeably is the percentage of closeouts greater than 10% has risen from 4.9% in 2019 to 13.9% in 2023. To put that in perspective, if the 2023 rate of 13.9% doesn’t change, that means that with 13,000 annual finishing closeouts, over 1,800 individual closeouts will be greater than 10%. Whereas in 2019, 637 closeouts would be greater than 10%.
On the other hand, closeouts with less than a 3% average has decreased from 2019 at 36.7% versus 2023 at 23.8% (12.9% decrease or 35% change). This means that in 2019, the number of closeouts would be slightly above 4,770, whereas in 2023, the number of closeouts would be almost 3,100. That means that those 1,670 groups moved into the grey area and maybe even the red.
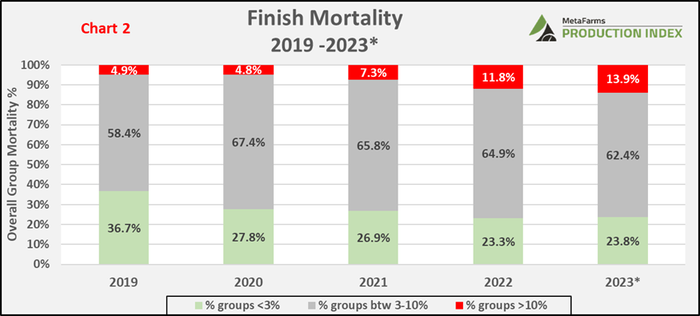
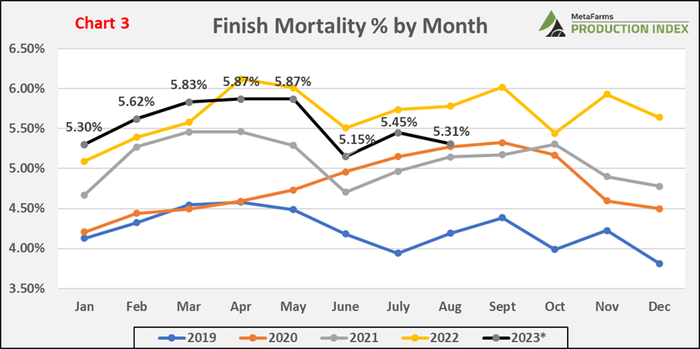
Chart 3 looks at the average finishing group mortality rates by month across the last five years. When looking at these monthly averages, it is important to understand when the groups started on feed. This is important when understanding the correlation between health breaks in the sow farm, which typically sees increases in porcine reproductive and respiratory syndrome positive cases beginning in October/November timeframes. In 2022, finishing closeouts averaged 116 days on feed which meant that the closeout groups for May 2022, started on feed in January or February of the same year. Furthermore, it meant the nursery source group would have started in November of the previous year, just in the thick of PRRS season.
Higher finishing closeout mortality averages have historically occurred in the later part of the first quarter and into the second quarter before beginning to taper off. Encouraging glimmers of hope are the monthly average trends in 2023 are lower than that of 2022. However, remember in Chart 1 that the average finishing closeout is at the same level in 2023 than in 2022. What this tells me is the number of higher mortality closeouts grew, which unfortunately, Chart 2 backed up.
Thus far, all the discussion found within this article has been focused on mortality rates. Now let’s look at the impact that mortality rates have on performance on finishing closeouts. In the chart below you will see the first eight months of 2023 finishing closeout performance broken down into the three mortality buckets as was shown in Chart 2.
Not surprisingly, closeouts with less mortality have better performance. Healthy pigs are active thus seeing better growth rates and conversion of feed intake to growth rates than those pigs with higher death loss.
Key differences between groups closed out <3% and >10% mortality rate:
12.56% mortality rate
15.9 pound starting weight
21.6 more days on feed
0.26 average daily gain
0.29 adjusted feed conversion
$0.0428 feed cost per pound gain
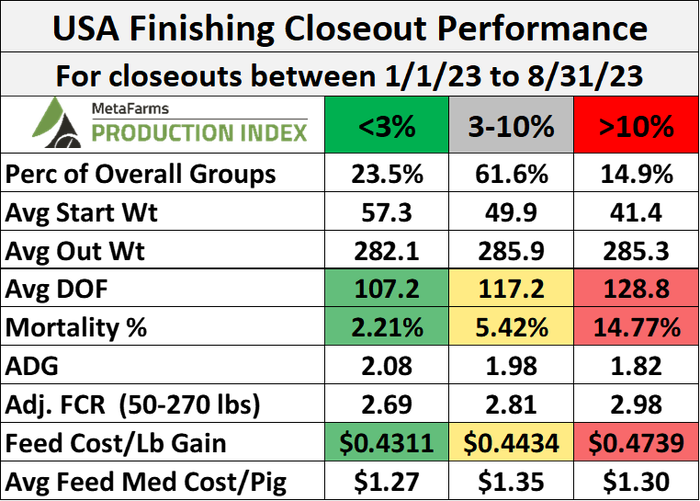
So where do we go from here? Have finishing closeouts reached their apex? Is the worst over? Call me a pessimistic person, but I would guess probably not. Let us take a moment to look at a key indicator from the chart above. Starting weight differences between groups <3% and >10% mortality rate was 15.9 lbs. A bigger, heavier starting pig makes a world of difference.
Furthermore, looking at those >10% groups to look at the nursery closeouts would be some good indications on what type of start those finishing groups had. An analogy would be comparable to a racer about to begin a 100-meter dash while having a 15-second delay along with carrying a 50-pound iron ball down the racetrack. These challenges do not directly result in the racer not being able to win or at least to be competitive, but the likelihood of that racer making it to the podium is slim-to-none.
The pork industry is in a situation where actions are needed for results. There is no silver bullet or magic foo foo dust. For finishing closeouts to have less death loss, let us all start with and master the three core components of animal husbandry: feed, water and air. If we can successfully implement and execute these three, then our chances of winning the race have improved substantially. If your company is looking for more revenue, focus on the core three and then watch more pigs generate revenue rather than filling space in your compost facility.
MetaFarms Analytic Insights were used to provide the context and trends for this article. If you would like to talk or see an analysis of finishing mortality trends for your farm, or if you have suggestions on production areas to write articles about, please e-mail or call us. We enjoy being a part of the National Hog Farmer Weekly Preview team. Previous Production Preview columns can be found on the National Hog Farmer website.
If you have questions or comments about these columns, or if you have a specific performance measurement that you would like us to write about, please contact Eckberg via email.
You May Also Like
Enter a zip code to see the weather conditions for a different location.