

Subscribe to Our Newsletters
National Hog Farmer is the source for hog production, management and market news
The release of December export data last week completed the information needed to ascertain annual export performance and the annual year-on-year change in the demand for various meat proteins.
February 19, 2013

The release of December export data last week completed the information needed to ascertain annual export performance and the annual year-on-year change in the demand for various meat proteins. Figure 1 shows monthly exports, by country, for major U.S. pork customers.
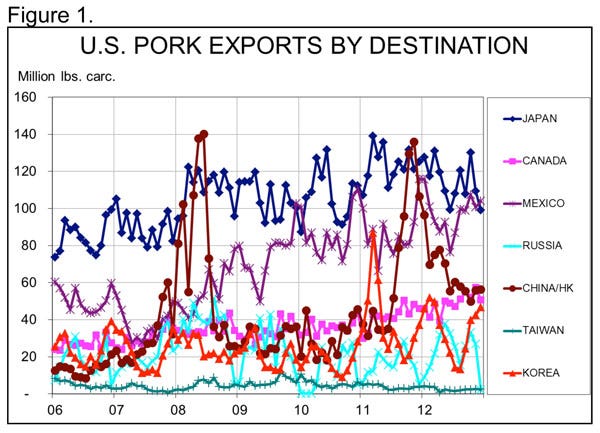
As expected, December pork exports were sharply lower than one year ago, falling 13.6% below the level of December 2011. The decline, of course, was led by a 47.3% reduction in exports to China/Hong Kong. That percentage drop was less than the 62% decline in shipments to Russia, but it is from a much larger base. In other words, the unit reduction to China/Hong Kong amounted to 67 million pounds, carcass weight, compared to the 3.3 million pounds year-on-year reduction of shipments to Russia.
Perhaps more concerning was the 21% (26-million pound) reduction in shipments to Japan, which fell to No. 2 in the monthly export rankings in December. Mexico was the top destination for U.S. pork in December, even though the monthly total of 104 million pounds was 10.2% lower than last year. Japan remained our largest customer for the year, but purchased 6.9% less pork on a carcass weight basis. Mexico remained No. 2, but bought 12% more U.S. pork.
December exports were easily large enough to leave the 2012 total at a new record of 5.383 billion pounds, carcass weight equivalent. That figure is 3.7% larger than last year’s previous record and represents 23.2% of total carcass weight pork production. Product weight pork muscle cut exports were 3.4% higher than last year. Add in variety meats and sausage casings and 2012 product weight shipments were up fractionally – only 0.4%. The value of those shipments was up 3.5% due primarily to much stronger per-unit pricing of variety meats.
Per Capita Pork Consumption
These export data were the last piece needed to compute per capita consumption for 2012. That figure was, in turn, the last one needed to compute demand indexes for last year as well.
The news for pork was not good, but not bad either. The consumer-level demand index for pork ended up 0.3% lower than one year ago (Figure 2). It’s been another year of steady-as-she-goes pork demand – neither as good nor as bad as we have seen in some years. The change was the result of a 0.6% increase in per capita consumption and 1.1% reduction in the deflated retail price.
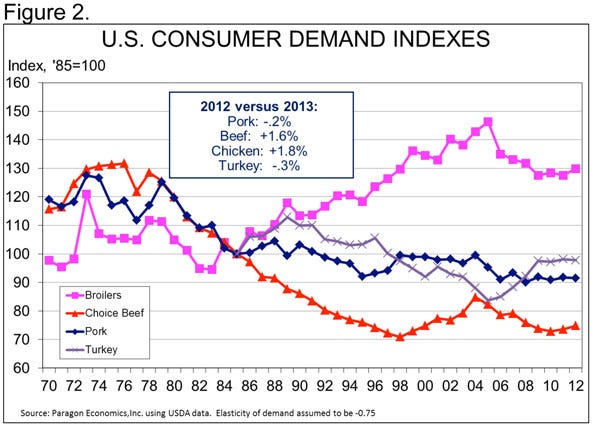
Again, as Figure 1 shows, it was not a banner year for any of the four major species. Beef demand softened as the year progressed. But chicken demand got stronger. Turkey demand had been higher all year, but fell sharply in November and December.
While last year’s pork demand performance was down slightly, the entire meat complex has run into a demand debacle in recent weeks. The pork cutout value has lost $5.00/cwt. Choice beef has fallen $8.50/cwt. since mid-January. The national composite broiler price fell by $8 during January before gaining back about $3 in the past three weeks. There have not been any supply surprises for any species.
It’s not that there has been some dramatic, negative incident such as H1N1, bovine spongiform encephalopathy (BSE) or the campaign against lean, finely textured beef. Nor have consumers decided to not buy pork, beef or chicken. In my opinion, we are seeing a combination of factors, all pushing in the same direction. Consider the following:
Russia’s ban on imports of U.S. pork, beef and turkey over the use of ractopamine. Few, if any, observers believe this action is really about ractopamine. More likely, it is a combination of things: retaliation by Russia over our mention of human rights issues during the recent permanent normal trade relations debate, their protection of an industry they have vowed to grow to self-sufficiency by 2014 (not likely to make that deadline), and the fact that many owners of the “new” Russian pork industry are either well connected to political leaders or are themselves high-ranking officials.
Exchange rates have changed. Two key changes are working against the United States. One is the decline in the Brazilian real, which likely has a larger impact on beef and chicken. The other, the devaluation of the yen, is of much greater concern. The value of the yen has fallen 20% since the end of September and is currently at its lowest level vs. the U.S. dollar since May 2010. But it’s important to realize that the current rate of 98 yen per dollar is still higher than any value seen before the end of 2008. The devaluation represents a significant reduction in Japanese consumers’ buying power, which has driven the performance of our No. 1 muscle cut volume and value market.
Weather may have had a bigger impact than we thought. Superstorm Sandy hit a huge portion of the U.S. population, sapping resources. The large snowstorm two weeks ago slowed the activities in a large chunk of the country, too. This week’s New England storm will not help either.
It’s February. Real per capita expenditures data indicate that February is the lowest month of the year for beef demand, second lowest for chicken demand and third lowest for turkey. The lowest months for pork demand are April through June. February is hardly ever a good month for pork and this year appears to be even worse than most.
Gasoline prices have skyrocketed again, soaking up cash in the short run. The national average price of gasoline has gained just over 9% since Jan. 1, which stood at $3.68/gal. last week, 2.6% higher than last year.
You May Also Like
Enter a zip code to see the weather conditions for a different location.


