What is the cost of a sow return?
Now it is time for you to evaluate the performance of repeats in your farm and determine how many of them should be bred if any.
In the database there are more and more farms that are not breeding any returns and are often asked how they can afford to do that. Most of these farms have farrowing rates of 90+% to start with. The Swine Management Services Benchmarking Database shows a range of zero repeat services to 24.8% over the last year.
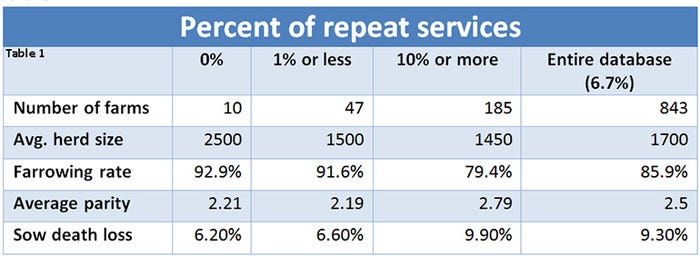
In Table 1 we broke out the benchmarking database to look at the percent of repeat services by those with none, less than 1%, 10% or more, and the entire database which averaged 6.7% repeats for the last year. There were 212 farms that average over 90% farrowing rate for the last year, and they ranged in repeat rates from zero to 7.1%.
Then we took a subset of 40 farms to evaluate individual sow data, a total of over 547,000 matings from the subset of farms in all size ranges. In this there were just over 40,000 repeats. Farrowing rate on first service females (maiden gilts or weaned sows) was 91% while second services (sows that repeated one time) were 73%. There was 0.5% of the matings that were three-plus services and went all the way up to 10 services with a farrowing rate of just 48%. We feel that there should never be three-plus services repeats at the farm, they should always be culled.
Chart 1 shows the second services broken out into groups by days to return service. We evaluated both the number of nonproductive days as well as the differences in total born compared to those that were first services. When putting into an economic model we made the assumption that the difference in total born would translate into the same difference in number weaned. The red line shows the number of days from service to service.
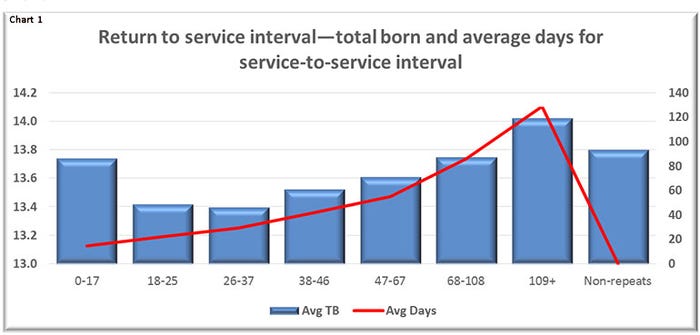
Table 2 shows the performance and the costs based on service to service interval. We used the cost of a nonproductive day at $2.50 and the value of a weaned pig at $35. We don’t feel like that is the only costs that need to be taken into consideration though when looking at repeats. For the sows that had a service to service interval at zero to 17 days there was a 63% farrowing rate on those animals, the first repeat costs of $38.14 only accounts for the cost for those that farrowed. What about the 27% that didn’t farrow and were in the farm for a given period of time before either being rebred again or culled. For this illustration we assumed that each female that didn’t farrow on the second service was in the farm for an additional 21 days and then divided the additional nonproductive day costs over the second service females that farrowed which resulted in an additional $19.40 per sow farrowed.
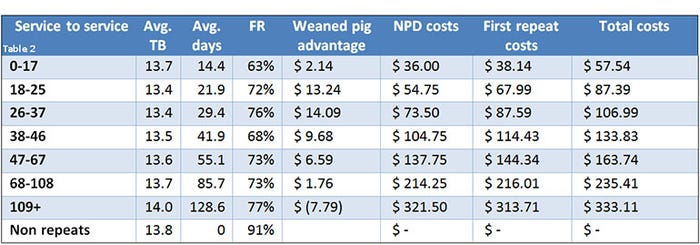
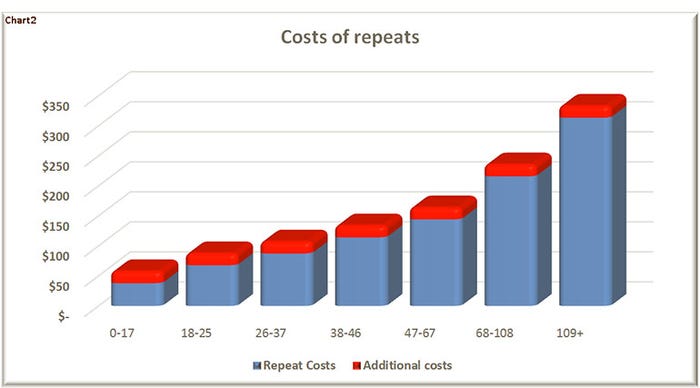
Chart 2 looks at the costs of nonproductive days and the difference in weaned pig value in blue. Then the additional cost of nonproductive days for those that didn’t farrow on second service in red. You need to share the data in this chart with your breeders and point out to them that the late return they found day 109-plus cost the farm $333.11 per sow.
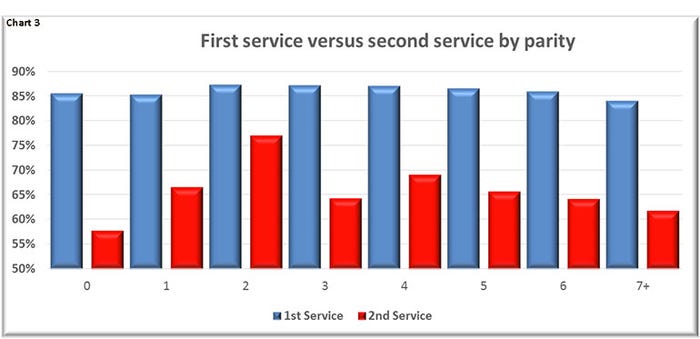
In Chart 3 we look at the difference in performance for first service females compared to second service females by parity. The average parity of the repeats in this dataset was at only 2.08 litters, another thing to take into account. If a sow is Parity 3 or older she has likely already paid for herself and it becomes even more costly to hang on to her. Often producers want to give younger parity sows another chance but it may not be cost-effective depending on how repeats perform in your herd.
Before any repeat should be rebred she should meet minimum criteria.
• Is she in good body condition, not thin and not fat?
• Is she sound?
• Does she have a history of repeats?
Now it is time for you to evaluate the performance of repeats in your farm and determine how many of them should be bred if any.
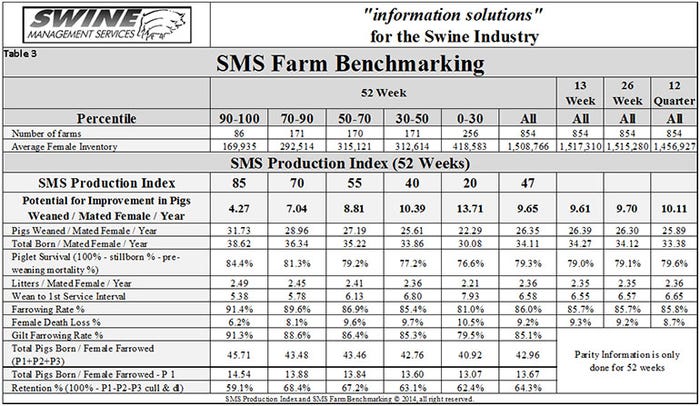
Table 3 provides the 52-week rolling averages for 11 production numbers represented in the SMS Production Index. The numbers are separated by 90-100%, the 70-90%, the 50-70%, the 30-50%, and the zero to 30% groups. We also included the 13-week, 26-week and 12-quarter averages. These numbers represent what we feel are the key production numbers to look at to evaluate the farm’s performance.
At SMS, our mission statement is to provide “Information solutions for the swine industry”. We feel with the creation of different SMS Benchmarking databases for all production areas we now have more detailed information to share with the swine industry. If you have questions or comments about these columns, or if you have a specific performance measurement that you would like us to write about, please contact Mark Rix, Ron Ketchem or Valerie Duttlinger. We enjoy being a part of the NHF Daily team. Previous columns can be found at NationalHogFarmer.com.
About the Author(s)
You May Also Like
