Subscribe to Our Newsletters
National Hog Farmer is the source for hog production, management and market news
Measurement and data could be essential to moving beyond a one-size-fits-all approach to swine housing and are two of many ways to enable the individual innovation of the producer and the facility.
April 26, 2017

By Brett C. Ramirez, Iowa State University Department of Agricultural and Biosystems Engineering Graduate Research Assistant
As previously alluded to in last month’s column, today’s ventilation controllers are collecting “big data” from the continuous monitoring of temperatures, fan status, inlet open percentage, curtain position, feed bin weights, water consumption, LP usage, etc., and conveniently placing all this data on the cloud. This vast influx of information begins to raise questions such as: how do we manage this data? How to do we analyze this information to obtain something useful? And most importantly, how do we use the data to create better designs and make improved management decisions?
Currently, no single answer exists. This column will take an initial step at answering these questions and provide some insight on the future of using data to create high-performance facilities. Measurement and data could be essential to moving beyond a one-size-fits-all approach to swine housing and are two of many ways to enable the individual innovation of the producer and the facility.
Let’s first assume all these sensors that provide this “big data” are correctly calibrated and placed in the correct locations throughout the facility (this is a whole other discussion that we will not get into here). This is a strong first assumption we need to keep in mind, because garbage in equals garbage out. Nevertheless, many controllers today can constantly collect data at user-specified intervals anywhere from one minute to one hour between samples. The frequency plays an important role in determining what inquiries on the data we can make, for example, if data is only collected every hour, we cannot determine rapid temperature fluctuations. Every controller will have its own “black box” for recording raw data and returning it in a usable form.
Most of the time this data, one way or another, can be opened in a spreadsheet for easy graphing and analysis. During the data management process, things to keep in mind include making sure sensors are labeled correctly and the corresponding physical location is documented. Also, files should be separated by room and combined with other rooms. Data needs to be kept organized and in an easy-to-use system such that other people can readily work on it.

Once the data is in a usable form, the next most important task is analysis. Techniques are constantly under development and getting better every day; however, this does not suggest a complicated solution is needed for a simple problem. There is an opportunity to move beyond just reporting daily high and low room temperatures and dissect this “high resolution” data. The next thing to do is from inspection, analyze the data to determine if something could be improved or changed to perform better the next time.
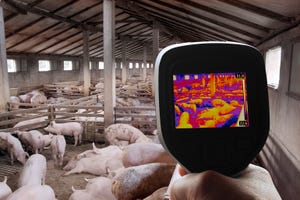
Now we get into the fun part — practical uses for this data. We could potentially improve the operation of the facility, predict what will happen in the future, and improve future designs. We could analyze the distribution of temperature down the length of a tunnel-ventilated barn to determine if any heat accumulation is occurring. If so, the ventilation rate may need to increase or something else is inhibiting the proper flow for that fan stage. This could lead to inspecting fan belts for tightness, restricted inlet open area, etc. We can also use this data to challenge our current control systems to perform better and provide the stable thermal environment we desire. We can also start to inspect energy usage and identify systems that could be improved.
For example, a simple post-processing check is to review the set-point temperature maintenance in a room. Set-point ramps with growth are common-place, and the assumption is made that the controller is maintaining what is desired. Reviewing individual room temperature maintenance will uncover inadequacies in control and guide a reassessment of this set-point ramp. Additionally, a review of the collected data can be used to assess the adequacy of evaporative cooling during perceived heat stress conditions. Is the evaporative cooling system achieving desired outcomes inside the barn? Is the decision to operate evaporative cooling adequate? Are you turning on evaporative cooling when not needed and potentially adversely affecting production? While these are just some of the numerous potential applications of this data, there is still work to be done to get the framework for performing these analyses in place.
There is a wealth of information we can learn from the building system’s data, which are often collected and recorded by default. The location and accuracy of the sensors generating this data should always be kept in mind, along with the organization of the data on the computer. The analysis can be paired with the question to help drive better management and decision making. The post-processing of all this collected data should be performed on individual rooms as “one size” does not truly fit all.
In next month’s column, specific examples of using collected data to assess heat stress mitigation will be given, in preparation for the hot summer months headed our way.
You May Also Like
Enter a zip code to see the weather conditions for a different location.