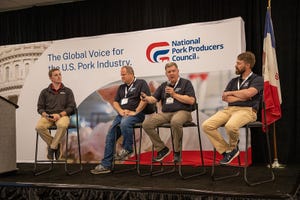
National Hog Farmer is part of the Informa Markets Division of Informa PLC

This site is operated by a business or businesses owned by Informa PLC and all copyright resides with them. Informa PLC's registered office is 5 Howick Place, London SW1P 1WG. Registered in England and Wales. Number 8860726.

Mexico’s Pork Buying Edges Closer to Japan’s

U.S. pork exports in October were 6% lower on a product weight basis than those of October 2008. The decline in the most recent month for which data are available is a bit of a disappointment, since September had seen exports go to the positive side of the year-on-year ledger for the first time since March.

U.S. pork exports in October were 6% lower on a product weight basis than those of October 2008. The decline in the most recent month for which data are available is a bit of a disappointment, since September had seen exports go to the positive side of the year-on-year ledger for the first time since March. The October results put year-to-date exports of pork cuts at 2.543 billion pounds, 14.1% below last year’s record pace. Figure 1 contains year-to-date figures for key U.S. and global markets.

Mexico remains the clear leader in terms of 2009 export trade, growing 33% vs. last year. Total shipments to Mexico through October were 586.4 million pounds. That holds Mexico as our second-largest pork market, pulling the country within less than 160 million pounds behind Japan – the closest that relationship has ever been at this time of year. Given what I have heard about reductions in Mexico’s breeding herd since last spring, I would not be surprised to see shipments to Mexico surpass those to Japan in some months in 2010.

Mexico and Canada were the only major markets for U.S. pork that grew in October compared to last year. Monthly shipments southward totaled 67.2 million pounds of pork cuts, 10.6% higher than in October 2008, while 29.4 million pounds went to Canada – a 4.1% increase over 2008.

China was dead even with last year’s total, while all other markets were down. The good news is those percentage declines were smaller across the board than the declines in September. Part of that “less decrease” is due to comparing to October 2008 shipments that were smaller than in previous months.

Value-Volume Differential
The value of October pork cut exports was $315 million, 19.6% lower than last year. Even so, that number contains a positive as it implies that per unit pricing improved in October since value was down only 5.5% more than was volume. That value-volume differential was 18.3% in September and 9.7% in August.

Japan is still the far-and-away leader among export markets in terms of value (see Figure 2). October shipments to Japan were worth $129.5 million, over 2.5 times the value of shipments to second-place Mexico. The value for October pork exports to Japan is down 6.3% from last year, while the year-to-date value is still up 0.9%.

October also marked a slowing of pork variety meat exports, putting the 2009 year-to-date total below the respective 2008 level for the first time. Pork variety meat export levels have been higher all this year as, presumably, foreign consumers substitute lower-price variety meat items in response to the worldwide economic downturn. This slowing of variety meat exports could well be another sign that economic conditions are improving in these key export markets.


Figure 3 shows year-to-date pork variety meat totals for the world and for key markets. Mexico’s performance stands out in this product category, too, with quantity up 37.2% and value up 18.2% (Figure 4) through October. China-Hong Kong remains a solid number two for pork variety meat exports with both quantity and value remaining about even with 2008 through October. That is a far cry from 2009 shipments of pork muscle cuts to China-Hong Kong which are 62% lower in both volume and value this year.

Total pork and pork variety meat exports through October totaled 3.302 billion pounds valued at $3.392 billion. Those numbers are 11.1% and 14.2%, respectively, lower than last year.

Finally, Figure 5 puts all of these numbers in a long-term perspective on a carcass weight basis. Clearly, October was the best month so far this year for pork exports and while still not as good as last year, it shows shipments this year were still over 20% larger than those of October 2007. We now stand 5.2% above the 2004-2007 trend (see red line in Figure 5) so far this year so, when compared to what I believe is a more representative and realistic history than is represented by 2008 exports, the U.S. pork industry has done pretty well in 2009.

And all of this is translating into higher product values and higher prices – at last. More on that next week!

Click to view graphs.

Steve R. Meyer, Ph.D.
Paragon Economics, Inc.
e-mail: [email protected]

Top Viewed Articles for 2009

1. Free Selection Guides and Management Posters
2. New Product Tour 2009
3. What is Net Present Value?
4. Cash Flow Hedges Have Accounting Implications
5. Dealing with H1N1 Flu Questions

6. The Swine Industry is at a Crossroads
7. Feed Alternatives Not A Quick Nutritional Fix
8. Big Guys Announce Sow Herd Cuts, Others Wait
9. Pork Industry Here to Stay
10. Putting the Hog:Corn Ratio in Context

TAGS: Marketing