When it comes to your data, what are the best tools to turn to?
December 1, 2021
By Bradley Eckberg, Production Consultant, MetaFarms/SMS
“When performance numbers are important and when should they be analyzed?” Users of the MetaFarms Platform commonly ask questions regarding the analytics that MetaFarms has to offer. Whether the need is for a customized Microsoft PowerBI dashboard view or a scheduled weekly report that shows market sales data, the MetaFarms platform can help users make data driven decisions, rather than a gut feeling. In this monthly article I will share some of common customer questions or requests around data.
MetaFarms, Inc. is a Minnesota based company that was founded in 2000 that currently has 28 employees that are all based in the United States. MetaFarms has over 425 sow farms with nearly 1.3 million active sows, along with 40 million carcasses that go through the system on a yearly basis. With over 200 customers, that vary in size and complexity, along with over 7,500 active users that vary in age, knowledge of software leads to questions and requests for data analysis daily.
Sow farm performance can lead to a friendly competitiveness within a sow farm or across other sow farms. Utilizing a dashboard view, like Image 1, shows weekly rankings across six different sow metrics with each metric being ranked, and scored, individually across all sow farms. Although a sow farm may not be as productive in total born (note the sow farm Pigsqueak), does well with pre-wean mortality %. This is example of sharing information with the sow farm staff on how they are doing while motivating the staff to be the best.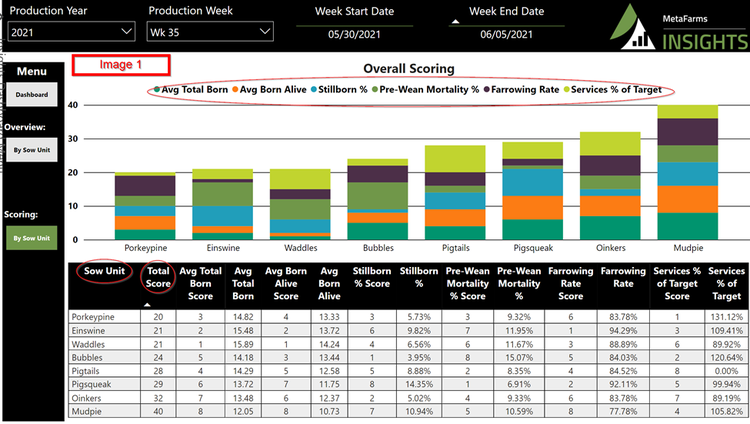
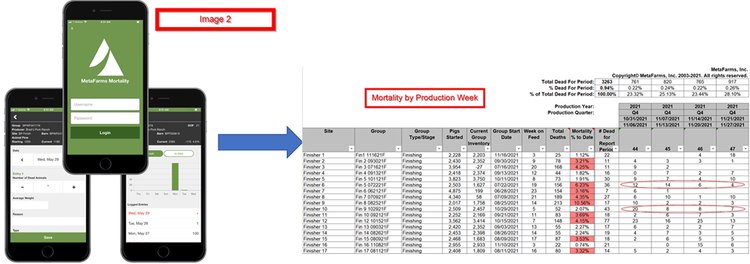
In 2016, MetaFarms developed and released a mobile application that allowed producers to enter grow finish mortalities at the barn itself. The need for more up-to-date mortality information was heavily desired by our customers which needed to be done in a way for users to have an easy process to enter information that would directly tie into the MetaFarms Platform. For mortality analysis, most asked questions are: “How many pigs are dying and when are they occurring?” As of today, MetaFarms customers have added over 3,000 Mortality App users with over 85% of all reported mortalities coming by way of the app.
Image 2 shows how utilizing the MetaFarms Mortality app ties directly in a mortality report such as the MetaFarms Mortality by Production Week report. The report is a heavily used MetaFarms report that allows users to see mortality quantities with trends over weeks. Prior to the MetaFarms Mortality app, producers would report mortality information on a weekly, monthly, or some do not report any information until the last pig have left the group. Mortalities can add up in a quick hurry, so having an easy-to-use tool to enter mortality information expedites the process in making mortality analysis.
Marketing pigs is a crucial step in pig production. Major decisions need to be made on daily basis including when and what pigs to take to the packer. Furthermore, some packers like to have a lighter weight pig where other pigs like to have heavier pigs so producers that market to both scenarios have flexibility on to market the right pig weight to the right packer to maximize revenue and reduce sort loss.
Image 3A shows a quick dashboard view at daily live and carcass weight averages along with number of pigs marketed per day. Another area that is commonly overlooked is those discounted, condemned, and dead-on arrivals. The amount of money inputted into these discounted or non-revenue generating pigs are quiet substantial.
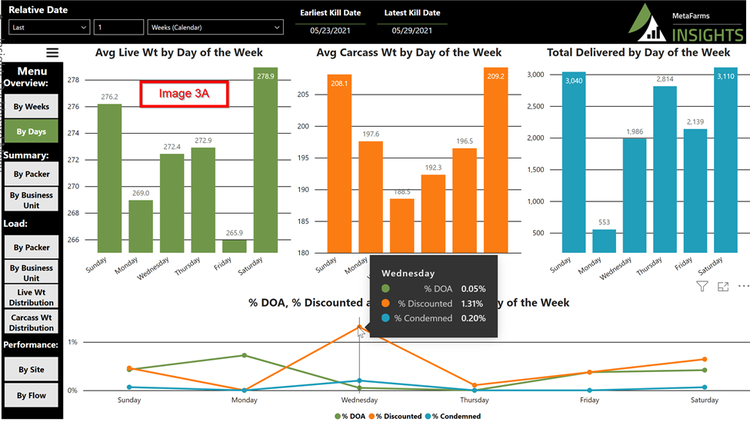
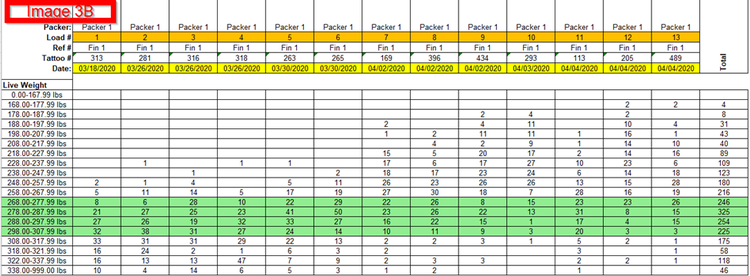
Image 3B shows the Group Market Load Distribution report for one group of pigs. This report is one of the top 20 utilized MetaFarms reports by the MetaFarms customer base. This report does an excellent job of laying out the number of pigs, broken down by weight ranges, based on delivery date and packer. Notice how the first market sale, on 3/18, had many pigs heavier than the desired green highlighted cells. Nearly 3 weeks later the weights of pigs moved light, which leads to more sort loss. For this example, analysis can be done if those lighter pigs could have been sent to a packer that wants lighter pigs or if the pigs could have stayed longer to get heavier out weights.
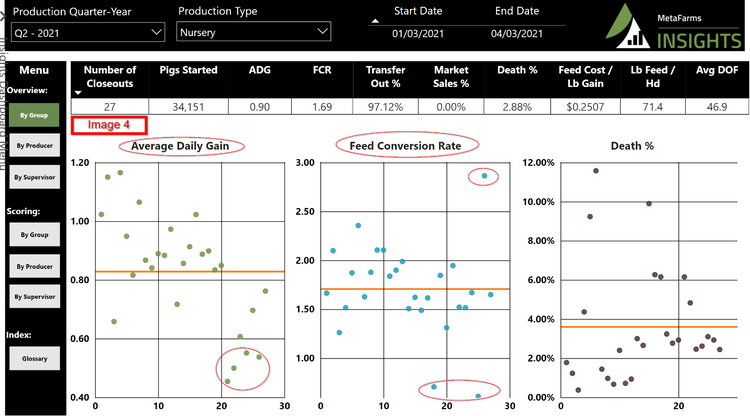
The last part of data analysis is on data validation. Record keeping programs, like MetaFarms, have rules and logic build into their programs to ensure that data being entered is as accurate as it can be in a diverse and sometimes complex pork industry. When analyzing data integrity on grow finish closeouts, the picture gets cloudier. Nearly 30% of all grow finish closeouts are scrubbed or removed from all MetaFarms benchmarking due to closeouts missing or having out of normal ranges on key metrics, such as average daily gain and feed conversion. When scrubbing occurs, several metrics are looked at to ensure that apples-to-apples comparisons can be done.
Image 4 shows how a PowerBI analytic tool can show closeout performance metrics outside of normal ranges. It is not uncommon for feed deliveries to be assigned to the wrong group or inaccurate starting weights, especially if newly arrived pigs are not weighed upon entry.
In pig production it can be easy to lose focus on data when having to deal with multiple issues that companies have these days. These days the pork industry is seeing their input costs increasing, another PRRS season underway and personnel challenges, making data driven decision on production is a must. If you are looking at building a new finishing barn, what type of feeders are the most efficient and cost effective for your pigs? Who has the keen eye for marketing pigs at the right weight at the right time? Is there a breed tech that has a substantial decrease in farrowing rates than other techs? Having a system production gateway system like MetaFarms can help you make quick and accurate fact-based questions.
MetaFarms Analytic Insights were used to provide the context and trends for this article. If you would like to see an analysis of how use data driven decisions around pig performance, rather than a gut feeling, or if you have suggestions on production areas to write articles about, please e-mail or call us. We enjoy being a part of the National Hog Farmer Weekly Preview team. Previous Production Preview columns can be found at www.nationalhogfarmer.com.
If you have questions or comments about these columns, or if you have a specific performance measurement that you would like us to write about, please contact: Bradley Eckberg at [email protected].
You May Also Like
