Each 1% improvement in death loss increases pigs weaned per mated female per year by 0.25 pigs.
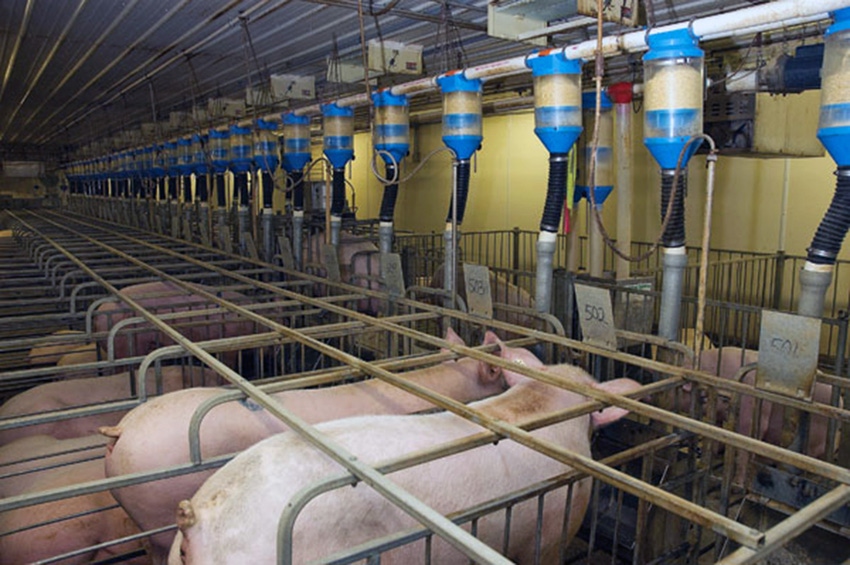
Sow death loss continues to be a big issue in the industry and has a significant financial impact on farms as well as the performance impact. When are sows most at risk of dying was a question posed to us recently, so this month we take a look at that.
To do this we pulled death loss records for 37 farms with 88,000 sows that were all on the same production software and looked at how many days from being served did death occur. This was the measurement we chose to look at as the most standardized. Looking at days from weaning doesn’t work because if the sow dies the day she farrowed she was also weaned that day. There were farms included that had a porcine epidemic diarrhea virus break but any that had a porcine reproductive and respiratory syndrome break or were not mature herds were removed from this analysis.
The 37 farms had an average parity of 2.64 and average death loss for the last year of 7.3%. Table 1 shows some of the key performance indicators for the 37 farms as well as the averages for the farms that are in the United States within the subset of farms and the Canadian farms, as well as the entire SMS database.
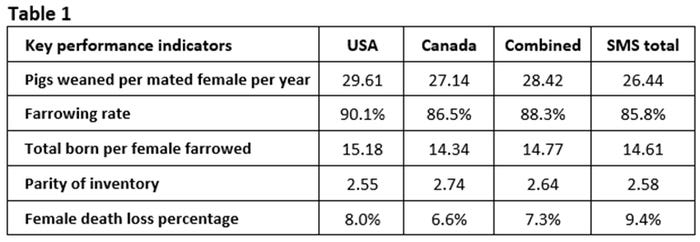
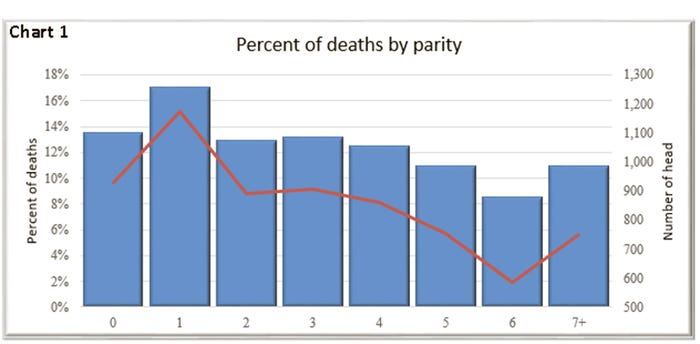
Chart 1 looks at the percent lost by parity. There was a higher percentage of first parity animals lost than any other parity. Chart 2 looks at when females are dying compared to being bred and how that changes by parity. One point of consideration when looking at this is there is a lot of variation in how farms enter gilts and often cases they are not being entered until breeding, however in this dataset it showed that 43% of the gilts that died were never bred which is 6% of the total losses in this dataset.
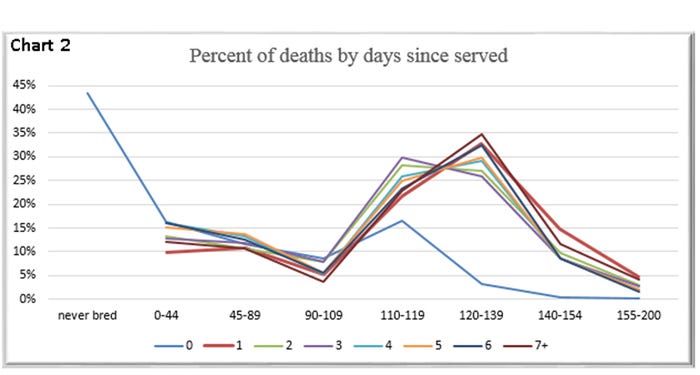
The gilt line is drastically different than the other parities. Another indication that gilts cannot be treated the same way we do the rest of the sows.
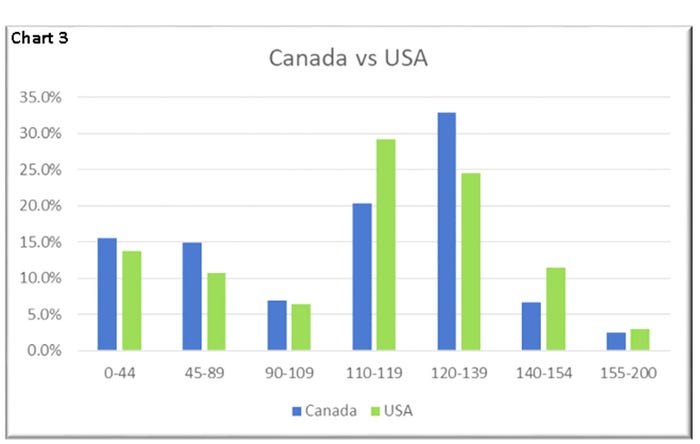
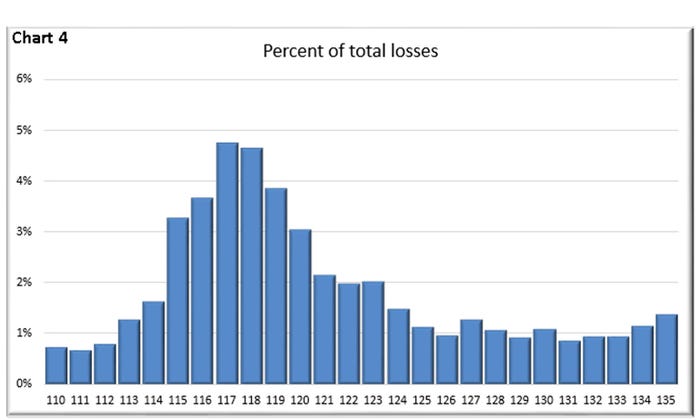
With the inconsistency in how gilt deaths are recorded prior to breeding, they were removed from the rest of the data that we looked at. In Chart 3 when combing parities, it shows that 54% of the losses occur between 110 days of gestation to 139 days after being served. However, there is a slight difference between the U.S. farms and the Canadian farms with respect to when they are dying in those two groups with 8.9% more dying day 110-119 in the U.S. farms at 29.2% compared to the Canadian farms at 20.3%. In Chart 4, looking at the range of 110 days to 135 days shows that 30% of the total losses are coming in just a nine-day period from 115 to 123 days.
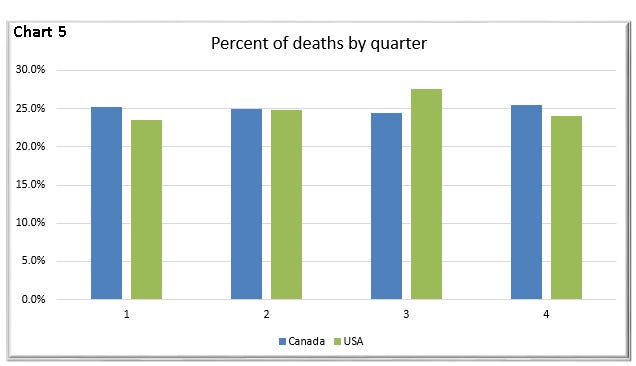
In Chart 5 we broke out when the sows are being lost by quarter. It was not what we had expected to see as we always think about higher deaths in the summer, but this shows really no significant difference between the calendar quarters. This may be a reflection of the seasonality of prolapses in some herds with the peak for those being in December through March. While there has been some work done in the past that shows that sows that are bred during the summer have a higher chance of dying during the next parity due to the over emphasis of reaching breeding target.
Prolapses have certainly been an issue in a lot of farms over the last couple of years and something that producers haven’t been able to change. So, producers need to focus on what mortality can be changed, lameness still tends to be the biggest reason for deaths followed by difficult farrowing. Difficult farrowing often gets used for any sow that doesn’t have a prolapse and dies close to farrowing.
If the data show that most sows are dying close to farrowing, is there increased focus during that time on ensuring that sows are healthy? Taking temperatures of sows after farrowing and 24 hours later is one way to help identify sows that need to be treated. In work completed by John Deen, sows that have one or more stillborns have a 24% higher chance of dying than those who had none. How are you assisting sows during farrowing? Do you have enough labor to do it timely? What is the protocol for sows that don’t eat? Are their temperatures taken? How are they being treated? Are sows coming into farrowing with some lameness issues that are causing them to not eat?
This dataset also showed that 6% of the total death loss was from gilts that were never bred. We suspect that this number is low compared to what is actually happening if all gilts were entered into the production software at 160 days of age. An increase in selection pressure is needed to reduce this. Gilts that are not structurally sound are often entering the breeding herd due to the need to meet breeding target. This is a vicious cycle that needs to be ended. Allowing unsound gilts into the herd results in higher death loss and thus increasing the need of replacement animals. How are the gilts managed on your farm? How much focus are you putting on gilt management and development? Are the gilts in a building with good flooring to help ensure that there aren’t additional risks of injury?
Each 1% improvement in death loss increases pigs weaned per mated female per year by 0.25 pigs. Is your farm working as hard at improving sow death loss as we are at improving farrowing rate and piglet survival that have 0.3 pigs weaned per mated female per year improvement for a 1% improvement? That doesn’t even take into consideration the financial impact of death loss compared to cull sow value.
Next month we will take a look at when the culls are occurring in this same subset of farms.
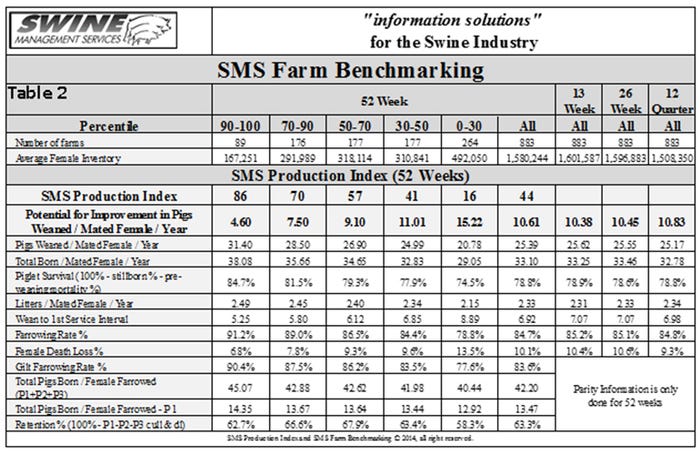
Table 2 provides the 52-week rolling averages for 11 production numbers represented in the Swine Management Services Production Index. The numbers are separated by 90-100%, the 70-90%, the 50-70%, the 30-50%, and the 0-30% groups. We also included the 13-week, 26-week and 12-quarter averages. These numbers represent what we feel are the key production numbers to look at to evaluate the farm’s performance.
At SMS, our mission statement is to provide “Information solutions for the swine industry.” We feel with the creation of different SMS Benchmarking databases for all production areas we now have more-detailed information to share with the swine industry. If your farm would like to be part of the SMS Benchmarking databases, or if you have suggestions on production areas to write columns about, email Mark Rix, Ron Ketchem or Valerie Duttlinger. We enjoy being a part of the NHF Daily team. Previous columns can be found at NationalHogFarmer.com.
About the Author(s)
You May Also Like
