Subscribe to Our Newsletters
National Hog Farmer is the source for hog production, management and market news
November 9, 2015

I was with a group of farms in Canada a few weeks ago and the topic of the effect of weaning age on wean to first service, farrowing rate and subsequent litter size was brought up. In our column last month, “Dive into total-pigs-born records for better production picture,” we looked at total born by parity 1, 2 and 3 and the effect of total born for the first three litters on productivity. So we decided to look at weaning age and its effect on total born as affected by wean-to-first service interval.
The last time we addressed weaning age was three columns in 2010: “Influence of weaning age on farm productivity,” July 2, 2010; “Performance by weaning age continued,” July 12, 2010 and “More thoughts on how weaning age affects sow productivity,” Aug. 9, 2010.
In those columns we used data from 686 farms with 1.211 million females. The data were sorted by weaning age average of each farm. At that time, we had seen weaning age increase from 18.2 days average in 2005 to 19.9 days in March of 2009 and the last data we have is for October 2015 up to an average of 20.46 days for the last 13 weeks.
At that time our conclusion was as weaning age average increased above 18 days and up, the weaning-to-first service interval went down, farrowing rate was improved and farrow-to-farrow interval increased due to older weaning age. When we looked at total born per female farrowed, we were seeing increase in all weaning age groups and felt that weaning age may not be a big influence on total born.
So in looking at weaning age again we took a different approach. Knowing that using averages may not be the best way to look at data, we selected 15 farms that have 25,501 females that we know have good individual sow data. In the last 52 weeks, these farms averages were 26.68 pigs weaned per mated female per year, 2.42 litters per mated female, farrowing rate at 87.8%, wean-to-first service interval at 5.81 days, 92.0% bred by seven days, 14.16 total born, 12.82 live born, 0.95 stillborns, 11.04 pigs weaned per female, 13.8% pre-weaning mortality, 6.7% female death loss and 54.8% replacement rate.
Individual farrowing data was collected from 25,501 females to look at weaning age. In Table 1 – Total Farrowings: All Parities – the table has the X-axis as wean-to-first service interval broke out by days: 0-3, 4, 5, 6, 7-9, 10-22, 23-29, 30-63, and 64+ days with the Y-axis being previous lactation length broken out by days: 0-13, 14, 15, 16, 17, 18, 19, 20, 21, 22, 23-24, and 25+ days. The table shows that when you break out the previous lactation length (weaning age) by individual farrowing there is a lot of variation. There were 71,745 farrowings with only 52.2% weaned day 19-22, 37.4% weaned at less than 18 days and 10.4% at 23+ days of age.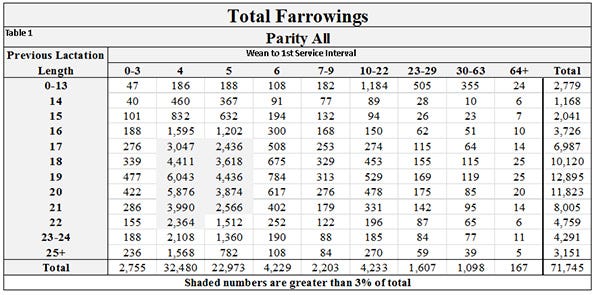
When you then look at when these sows came into heat (wean-to-first service interval) 87.0% were bred back by day 6. The table shows no matter what the weaning age was, there were individual females cycling days 0-3 which was 3.8% of the total and increased as weaning age went up and weaned females taking 10+ days to cycle with more of the younger weaning age females taking 10+ days. There was a sweet spot with weaning age of 17 to 22 days with wean-to-first service interval at four to five days where 57.9% of all the sows were bred.
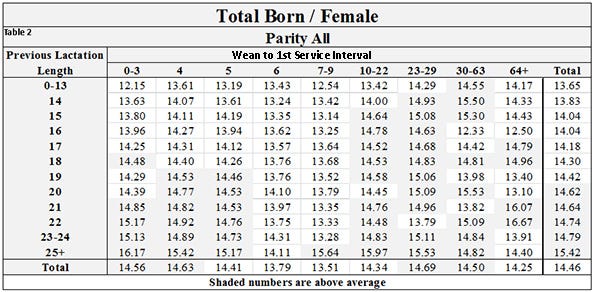
Now that we know there is a lot of variation in individual weaning ages and when those weaned sows cycle, what does that do to total born per female farrowed? In Table 3 – Total Born/Female Parity All – the table is laid out the same for the X and Y-axis.
There are some very interesting trend lines as to weaned females bred days 0-3, 4 and 5 after weaning showed a steady increase in total born as weaning age went up. Looking at females bred back on day 4 we saw total born go from 13.61 if weaned 0-13 days to 15.42 pigs if weaned at 25+ days and bred day 5 going from 13.19 to 15.17 pigs.
However, when weaned sows were bred days 6 and 7-9, the total born did not increase as much as weaning age went up with day 6 going from 13.43 to 14.11 pigs. Females bred day 10+ after weaning showed higher total born at younger weaning ages with weaned sows bred day 23-29 starting at 14.29 and going to 15.53 as weaning age went from 0-13 to 25+ days.
Now we all know that most of these females probably had a skip heat before breeding whether being a planned or unplanned skip.
To put this in to perspective Table 3 and Chart 1 – Total Born versus Wean to 1st Service Interval – which uses the averages by parity all and shows those weaned females bred early after day 0-5 had more total born per female. Females taking six and seven to nine days to cycle saw a drop in total born and female bred 10+ days after weaning total born going back up.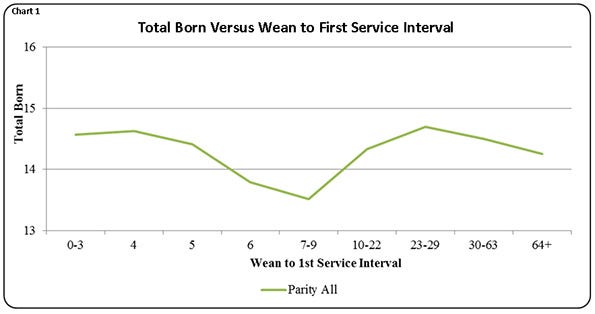
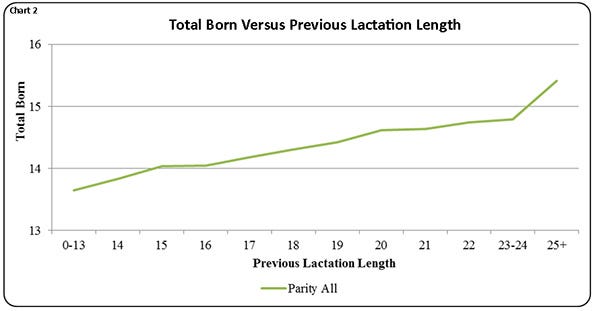
We know that a lot of the sows bred day 23+ have had a skip that helps to increase total born Table 4 and Chart 2 Total Born versus Previous Lactation Length uses the average weaning age Parity All to show as previous lactation length goes up so does total pigs born.
There is a lot of take-home in this column to think about. One for me was the large variation on lactation length (weaning age) across farms. This variation may be some of the reasons for week-to-week variation in total born so farms need to make sure there is a minimum weaning age followed every week. Also that making changes to how sows are fed in lactation and from weaning to breeding can lower wean-to-first service interval will help to improve total born. If you’re farm is pushing facilities and weaning age is an issue, you may need to make a financial investment in farrowing crates to increase weaning age or make changes in day-to-day management to reduce the number of shorter lactation lengths from being weaned and concentrate on lowering wean-to-first service interval.
Next month we are going to look at the influence of weaning age on P1 females.
Table 5 provides the 52-week rolling averages for 11 production numbers represented in the SMS Production Index. The numbers are divided by 90-100%, the 70-90%, the 50-70%, the 30-50% and the 0-30% groups. We also included the 13-week, 26-week and 12-quarter averages. These numbers represent what we feel are the key production numbers to look at to evaluate the farm’s performance.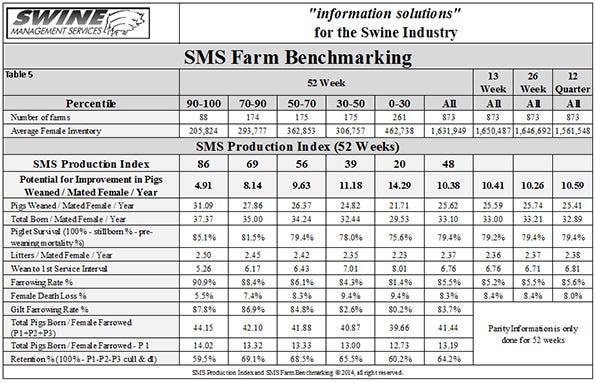
At Swine Management Services, our mission statement is to provide “Information solutions for the swine industry”. We feel with the creation of different SMS benchmarking databases for all production areas, we now have more-detailed information to share with the swine industry. If your farm would like to be part of the SMS Benchmarking databases, or if you have suggestions on production areas to write columns about, email or call us. We enjoy being a part of the National Hog Farmer “Weekly Preview” team.
Previous Production Preview columns can be found at nationalhogfarmer.com.
If you have questions or comments about these columns, or if you have a specific performance measurement that you would like us to write about, contact [email protected] or [email protected].
You May Also Like
Enter a zip code to see the weather conditions for a different location.


