The swine industry has a lot of work to do looking into and figuring out how to lower female death loss and culling.
This is the third part of articles looking at female death loss, culling and combined looking at total removals. As we all have seen, death loss has been going up the last few years. Attached is Chart 1: Female death loss, again to remind the industry over the last 14 years what has happened to female death loss.
The two trend lines are Top 10% (purple line) and all farms (red line). The data starting in 2006 show all farms at 9.4% and Top 10% at 6%. Both lines dropped with all farms down to 7% in 2010 and Top 10% down to 5.5% in 2012. Since then, both lines are in the increasing trend lines with all farms at 10% and Top 10% at 7.8% at the end of 2019.
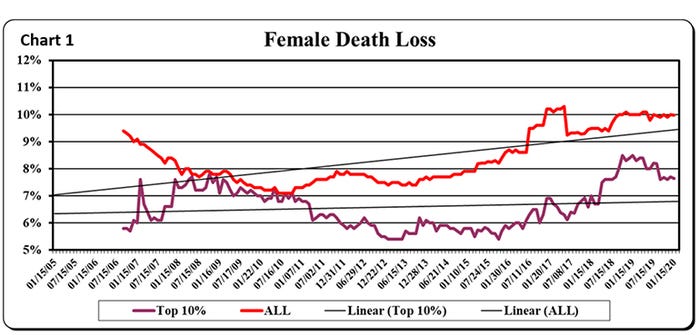
In looking at 2020 through the end of September, all farms were at 10.3% for the last 52 weeks and the last 13 weeks at 10.7%.
The data for charts 3 through 6 were for the last 52 weeks using data from 493 farms with 919,953 females. The range in size of farms was from 140 to 7,888 females. Farms must be at 22-plus pigs weaned per mated female and were not startups, depopulating or repopulating.
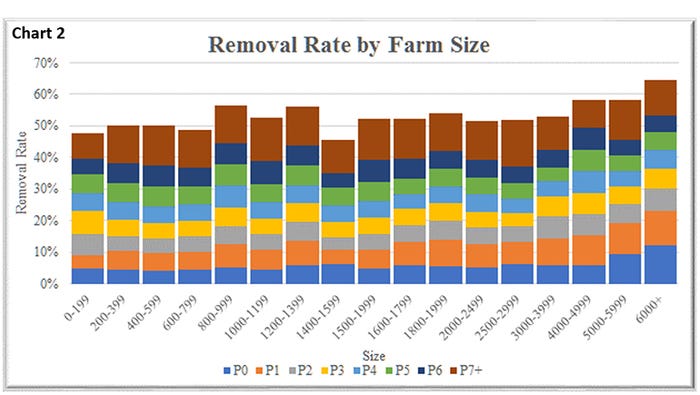
When we put together female death loss and culling, we then look at total removals. Chart 2: Removal rate by size of farm, shows a very interesting trendline with the smaller farms seeing about 50% removal rate moving up to about 55% for sow farms at 800 to 1,399 sows, and then the large farms of 4,000 to 4,999 sows at 59%, and 6,000-plus sows higher at 65%.
Why does removal increase as farm sizes goes up? Chart 3: Removal rate by pigs weaned per mated female per year gives a trendline like size of farm starting at less than 50% of farms at 22 pigs weaned per mated female per year and trending up to 61% for farms at 32-plus pigs. What is happening with the higher-producing farms seeing higher death loss and culling?
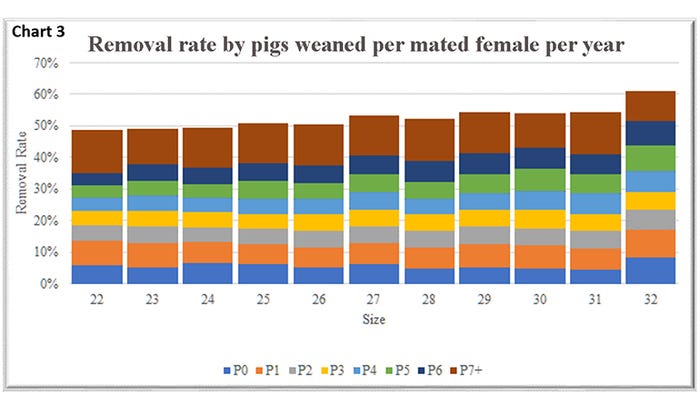
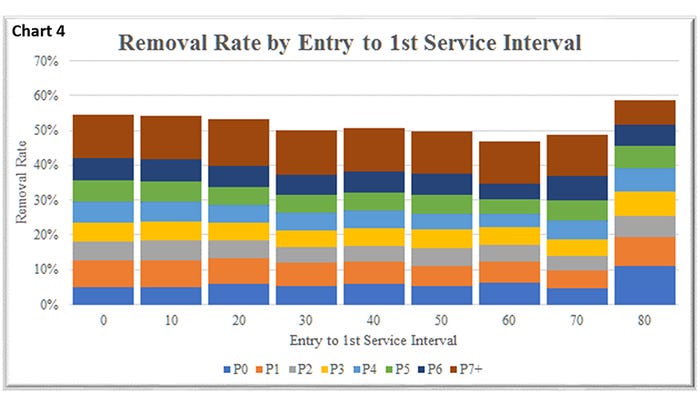
Chart 4: Removal rate by entry to first service interval, shows farms that have new gilts on the farm for 30 to 70 days saw total removals lower at about 50% versus gilts on the farm zero to 20 days moving up to 52% to 54%. Then the farms with females on farms 80-plus days were the highest at 58%. If you look at this column by parity, you see about 10% of the removals are Parity 0 females. Are these farms keeping a higher inventory and then culling more lower quality gilts that they did not breed?
To continue to look at the trend the last few years of younger females being culled or dying, the data were combined putting together Parity 0 to Parity 2 females that died or were culled. Chart 5: Removal by farm size shows farms under 1,599 sows had removals at 14.27% to 15.73% and started going up with farms at 1,600 to 5,999 sows increased from 18.49 to 25.22% and the larger farms of 6,000-plus sows at 30.21% of removals being Parity 0 to Parity 2 females. If you look at the data looking at the percent of Parity 0 to Parity 2 loss of total removals, you will see that the number is about 28.49% to 35.50% for sow farms under 2,999 females. The farms from 3,000 to 6,000-plus females then increase from 37.72% to 45.90%.
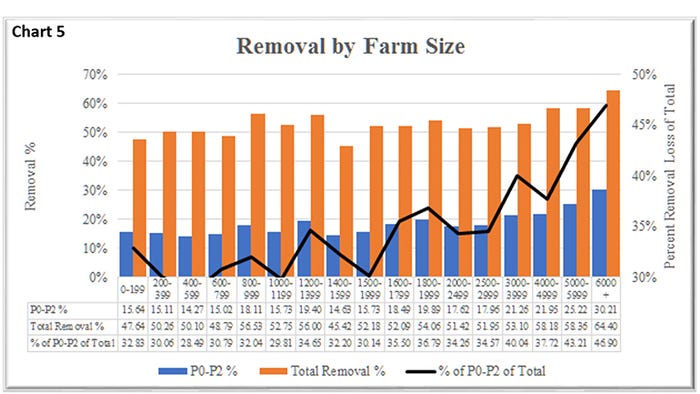
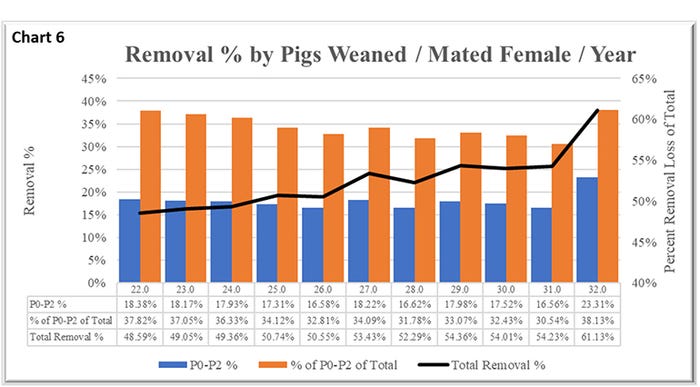
Chart 6: Removal percent by pigs weaned per mated female per year shows as total pigs weaned per mated female goes up, the percent of Parity 0 to Parity 2 for total losses (orange columns) goes down starting with 22 pigs at 37.82% to 30.54% for farms at 31.0 pigs and back up to 38.13% for farms at 32-plus pigs. When you look at total removal percent, the range is low from 48.59% to 54.35% for farms at 22 to 31 pigs with a jump to 61.13% for the more productive farms at 32-plus pigs.
What have we learned in these last three articles? When you look at death loss and total removals by size of farm, we saw female death loss lowest for the smaller farms at under 8% for farms under 1,600 sows and moved higher for farms at 2,000 up to 6,000 sows at plus-10%. When you look at culling, most farms up to 4,000 sows were very even at about 40% to 42% culling and the larger farms with 4,000-plus sows at 49%, to 54% for the farms at 6,000-plus sows.
When combined, the removal rate was under 50% for the smaller farms and up to 60% for the larger farms at 4,000-plus sows. In looking at trends for pigs weaned per mated female per year, death loss dropped as farms produced more pigs from about 10% to 6.5%, went up when looking at culling rate starting at 40.0% to 54% for the farms at 32-plus pigs. By combining death loss and culling to get total removals, we see farms at 22 pigs at about 50% moving to 52% for farms at 31 pigs and up to 60% for the farms producing the most pigs at 32-plus.
What is the industry going to do about increasing female death loss and culling, especially for the younger Parity 0 to Parity 2 females? We feel there needs to be a move to standardize female death loss, culling and euthanasia reasons.
Suggestions would be:
Disease/health: discharge, downer, disease and mastitis/metritis,
Performance: age, low total born, retained pigs, low weaned and poor milker,
Locomotion: unsound and lame/injury,
Reproduction: no heat, not in pig/pregnancy check negative, abortion, repeat service, vaginal/uterine prolapse, rectal/anal prolapse and difficult farrowing,
Intestinal: ulcer and off feed,
Other: transfer, other and trauma.
Reason type: C=cull, D=death and U=euthanized.
The swine industry has a lot of work to do looking into and figuring out how to lower female death loss and culling.
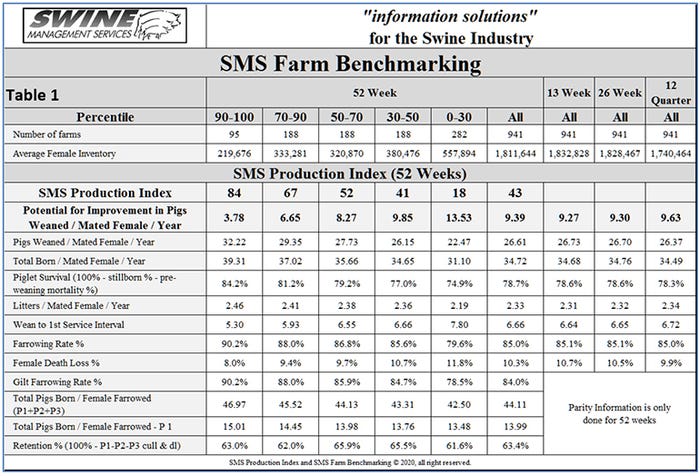
Table 1 provides the 52-week rolling averages for the 11 production numbers represented in the Swine Management Services Production Index. The numbers are separated by 90-100%, 70-90%, 50-70%, 30-50% and 0-30% groups. We also included the 13-week, 26-week and 12-quarter averages. These numbers represent, what we feel, are the key production numbers to properly evaluate the farm's performance.
At SMS, our mission is to provide "Information solutions for the swine industry." We feel with the creation of different SMS Benchmarking databases for all production areas, we now have more detailed information to share with the swine industry. If your farm would like to be part of the SMS Benchmarking databases, or if you have suggestions on production areas to write articles about, contact Mark Rix, Ron Ketchem or Connor Sharp. We enjoy being a part of the National Hog Farmer NHF Daily team. Previous articles can be found at NationalHogFarmer.com.
Sources: Mark Rix, Ron Ketchem or Connor Sharp, who are solely responsible for the information provided, and wholly own the information. Informa Business Media and all its subsidiaries are not responsible for any of the content contained in this information asset. The opinions of these writers are not necessarily those of Farm Progress/Informa.
About the Author(s)
You May Also Like


