The average for all 693 farms resulted in an increase in Parity 2 total born, but was not the case for all farms; 12.1% of the farms had lower total born on Parity 2 females.
In the past, a Parity 2 dip was a normal occurrence. Is it still? This was prior to farms using ab lib feeding and over the years the industry has placed considerable focus on improving lactation diets. A Parity 2 dip can be described in three ways.
Lower farrowing rate
Lower total born
Both lower total born and lower farrowing rate
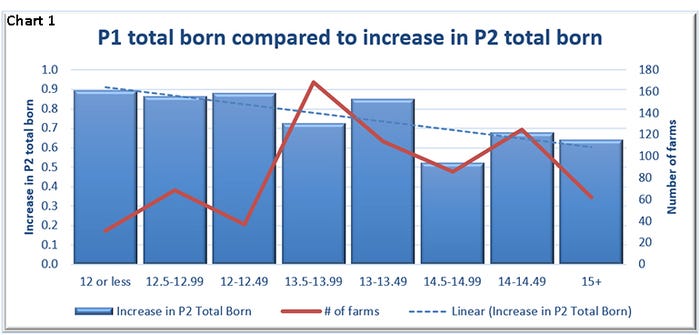
Looking at 693 farms over the last 52 weeks we broke the farms out into Parity 1 total born groups ranging from less than 12.0 total born to farms more than 15 total born on gilts. In Chart 1, those groups are graphed compared to the increase from Parity 1 actual total born to the Parity 2 total born. Regardless of the gilt total born, the 693 farms averaged 0.73 pigs total born higher in the Parity 2 females. The dashed line is the trendline indicating that the higher the Parity 1 total born was, the lower the Parity 2 increase was.
While the average for all 693 farms resulted in an increase in Parity 2 total born that was not the case for all individual farms. There were 12.1% of the farms that had lower total born on Parity 2 females. In Chart 2 we broke out those farms that had a higher total born for Parity 2 compared to Parity 1 females for the 52 weeks shown in blue and the farms 52-week pigs weaned per mated female per year number. Those farms with lower Parity 2 total born are in red. This shows that it really doesn’t make a difference if your Parity 2 total born is lower or higher than Parity 1s to the farm’s overall success. It does, however, show that the higher the Parity 1 total born, the higher the pigs weaned per mated female per year for the farm.
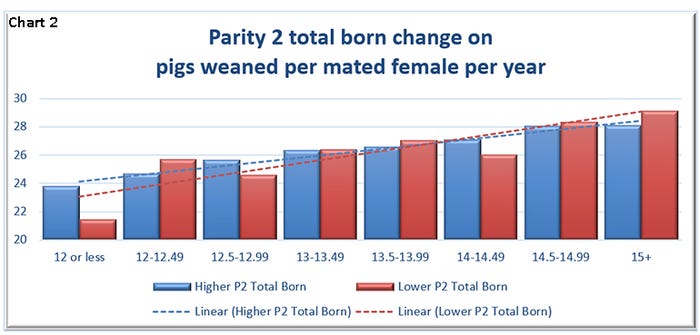
When looking at those farms with more than 30 pigs weaned per mated female per year, there was actually 23% of those farms that had lower total born on Parity 2s. However, there were only two of the 77 farms that had less than 13 total born on gilts that achieved the 30 pigs weaned per mated female per year mark. Sixty-four percent of the farms with 30-plus pigs weaned per mated female per year had more than 14.5 total born on gilt litters, showing the importance of total born in gilt litters if your desired goal is 30 pigs weaned per mated female per year.
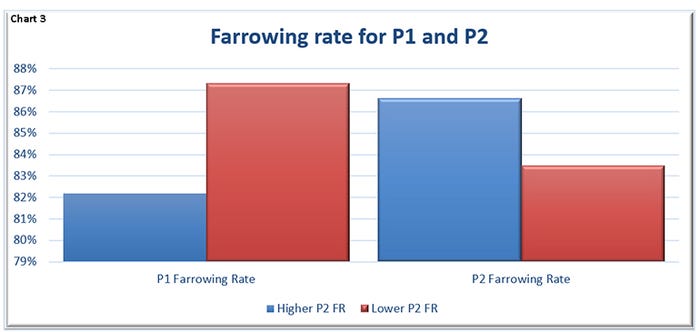
Switching to farrowing rate performance, 50% of the farms had lower farrowing on Parity 2s than on Parity 1s while 50% had higher farrowing rate. In Chart 3 it shows the farrowing rate for Parity 1 and Parity 2. The blue bar reflects those farms whose Parity 2 farrowing rate was higher than Parity 1, while the red bar reflects those farms with a lower Parity 2 farrowing rate than Parity 1. This shows that those who had a lower farrowing rate for Parity 2 females had 5% higher farrowing rate in Parity 1s than those farms that had a higher Parity 2 farrowing rate. In Table 1 some key performance indicators are listed for those farms with higher Parity 2 total born, lower Parity 2 total born and those farms achieving 30-plus pigs weaned per mated female per year. The farms at 30-plus pigs weaned per mated female per year had Parity 1s with the highest weaned per sow, the longest lactation length, had higher Parity 2 total born but lower Parity 2 farrowing rate.

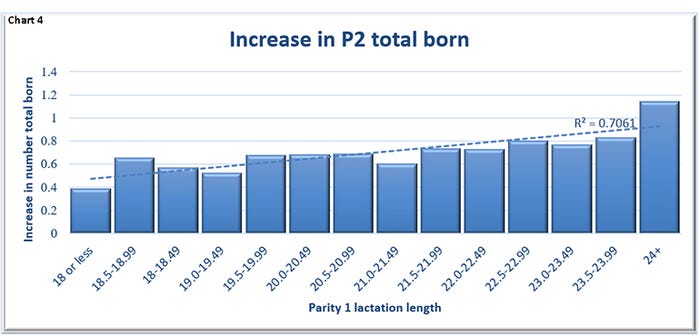
In Chart 4 it shows the impact of Parity 1 lactation length on the increase in Parity 2 total born. In this recent article, Chart 6 looked at individual animal performance in a smaller set of farms. The trend is similar: the longer they lactate, the higher the total born will be.
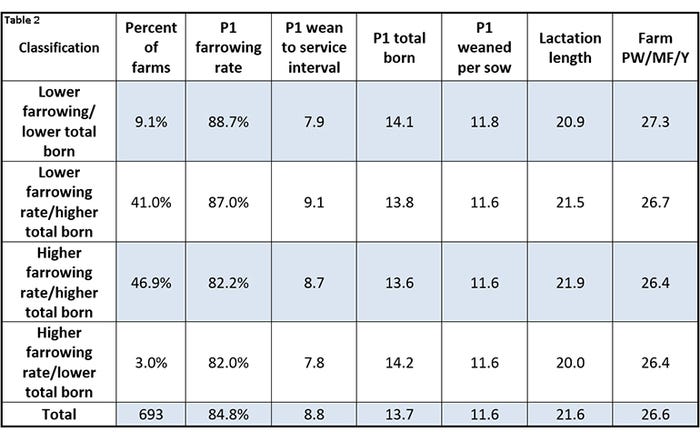
In Table 2 we look at the third way a Parity 2 dip can be classified: lower total born and lower farrowing rate. Nine percent of 693 farms fall into this classification. Interestingly enough, those had numerically the highest pigs weaned per mated female per year with just 0.9 separating the highest to the lowest.
So, is a Parity 2 dip normal?
Lower farrowing rate — Yes
Lower total born — No
Both lower total born and lower farrowing rate — No
What can you do to minimize the dips?
Proper gilt development
Ensure gilts are not coming into lactation over-conditioned.
Push feed in lactation and ensure that it is a high-quality feed.
Provide adequate boar exposure post-weaning
Feed weaned Parity 1 8-plus pounds of feed per day from weaning to breeding
The impact of season certainly can have an impact on the above numbers and within each farm likely varies. Eventually we are going to get to summer-like temperatures, and minimizing the negative impact of the warmer temperatures on your farm has a huge impact on the performance of the rest of the year. So, as we approach warmer weather here are some things to consider.
Step up feeder management
Warmer temperatures result in feed spoilage much quicker than during colder temperatures. Keeping feeders clean and the feed fresh is key to ensuring as much intake as possible.
Adjust timing of stressful activities
Moving sows can be stressful for them, doing this during the coolest part of the day can help reduce the negative impacts.
Adjust timing of feeding if hand-feeding lactation
If sows are not able to eat ad lib it is so important that you are getting feed into them in the morning before it gets too warm and then also again in the evening after it has started to cool off. This is considerably more effective if sows are actually getting up when the heat breaks and not just provided the feed before you leave for the day.
Does your farm see the Parity 2 dip? What are you plans to fix that?
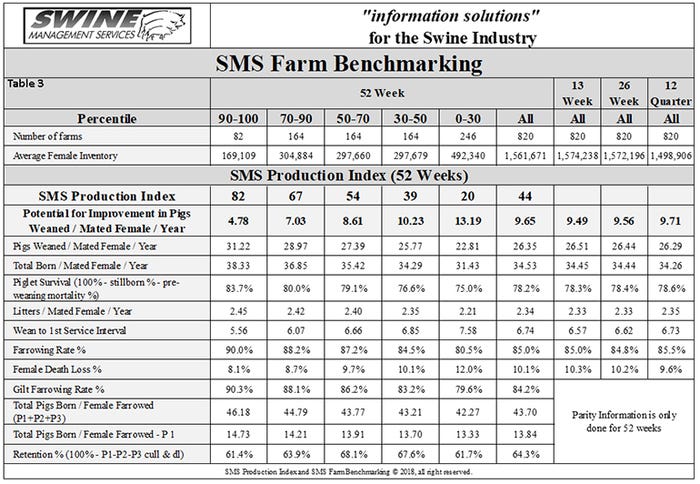
Table 3 provides the 52-week rolling averages for 11 production numbers represented in the Swine Management Services Production Index. The numbers are separated by 90-100%, 70-90%, 50-70%, 30-50% and 0-30% groups. We also included the 13-week, 26-week and 12-quarter averages. These numbers represent what we feel are the key production numbers to look at to evaluate the farm’s performance.
At SMS, our mission statement is to provide “Information solutions for the swine industry.” We feel with the creation of different SMS Benchmarking databases for all production areas we now have more detailed information to share with the swine industry. If your farm would like to be part of the SMS Benchmarking databases, or if you have suggestions on production areas to write articles about, please contact Mark Rix, Ron Ketchem or Valerie Duttlinger. We enjoy being a part of the National Hog Farmer NHF Daily team. Previous columns can be found at NationalHogFarmer.com.
Sources: Ron Ketchem, Mark Rix and Valerie Duttlinger, Swine Management Services LLC, who are solely responsible for the information provided, and wholly owns the information. Informa Business Media and all its subsidiaries are not responsible for any of the content contained in this information asset.
About the Author(s)
You May Also Like
