Subscribe to Our Newsletters
National Hog Farmer is the source for hog production, management and market news
March 5, 2012

The Top 10% of farms in the Swine Management Services (SMS) database have a 90.3% average farrowing rate for the last 52 weeks. Five farms exceeded 94% farrowing rate. We know that for every 4% improvement in farrowing rate, a farm will produce 1.35 more pigs/sow/year, on average. That makes farrowing rate a big driver to improving pigs weaned/mated female/year (PW/MF/Y).
We also know there is a lot of variation in total pigs born/litter between farms. The Top 10% of the farms for total pigs born/litter beats the SMS average for all farms by over a pig/litter – 14.42 pigs vs. 13.33 pigs. Clearly, breeding technicians affect both numbers and drive production.
To help farms improve farrowing rate and total pigs born/litter, we focus on a very detailed set of six reports called the SMS Breeding Analysis Program. Included in the report are:
Breeding Technician Analysis Farrowing Rate Charts
Farrowing Rate Report
Breeding Technician Analysis Total Born Charts, and
Total Born Report.
These first four reports look at performance of breeding technicians by the number of services, number of matings, wean-to- service interval, return interval, parity, day of week, hour of day and semen batch code or boar identification.
The fifth and sixth reports are the In-depth Analysis and the Breeding Weekly Analysis. These reports allow us to look at each breeding technician’s results for sows farrowed and the conception rate of females bred in the last 17 weeks. If you have made changes to breeding protocols or added a new technician, the conception rate reports allow us to see the effects before the groups have farrowed out.
For the next several articles we are going to use the power of the new Breeding Analysis Program to look at the breeding area in more detail.
Tracking Technician Performance
We have combined data from 11 farms in the United States and Canada for this analysis. To be included, a breeding technician had to average over 10 matings per week. We ended up with 34 breeding technicians, 80,013 matings, an average farrowing rate of 86% and 13.46 total born/female farrowed for 52 weeks ending Dec. 31, 2011.
The data that drives this analysis of each mating includes: female identification (ID), breeding technician ID, semen batch code or boar ID, and the time of the day of the mating recorded in military time (01-24).
Chart 1 presents Breeding Technician by Number of Services. Service 1 females are weaned sows and first time bred gilts, which should have the highest farrowing rate. The average farrowing rate was 87.4% (range: 63.6% to 92.8%. Ten technicians had farrowing rates over 90%.
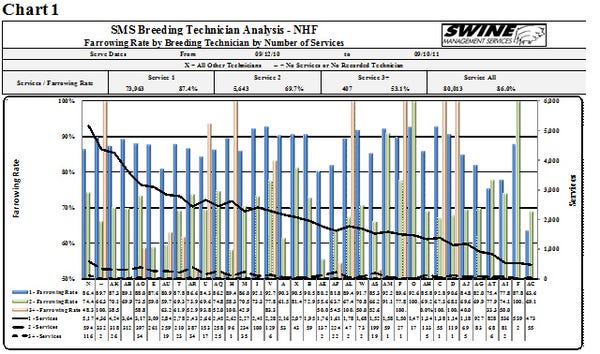
Service 2 females have returned to heat after their first service. Farrowing rate for these females during the 52-week period was 69.7%. Four technicians were below 60%. There were 0.5% of the females that were not culled after two services, rebred with a farrowing rate of 53.1%. Farms with several technicians have a lot of variation. In some cases, the technician doing most of the inseminations had the lowest farrowing rate.
To take a closer look at the effect of each technician and combinations of technicians, Table 1 (Breeding Technician by Number of Service) breaks the information out by Tech 1, Tech 2 and Tech 3, broken out by Service 1, Service 2 and Service 3.
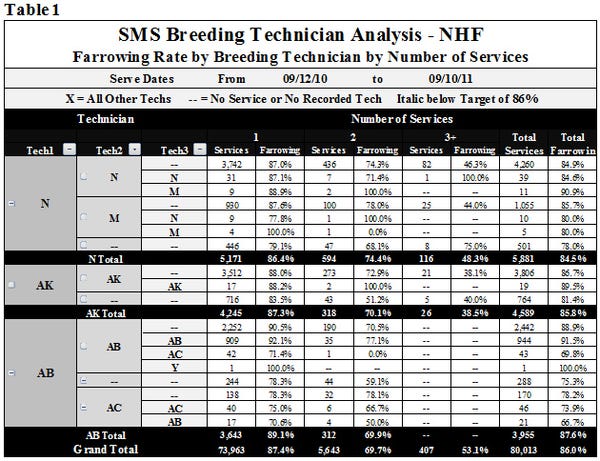
If you look at Tech N on Service 1, for example, you will see that when this technician was the first and second technician, there were 3,742 services with a farrowing rate at 87.0%. When Tech N mated females three times (31 services), the farrowing rate was at 87.1%. When females were only inseminated once by Tech N (446 females), farrowing rate was only 79.1%.
When data is broken out by technician, the performance of every technician or combination of technicians can be tracked and used to fine tune the breeding protocol to improve farrowing rate.
Technician Effects on Total Born/Litter
As we were developing the new reports, we decided to include total pigs born to see if breeding technician had an effect. Chart 2 shows the 34 technicians had an average total born of 13.46 pigs/litter with Service 1 females at 13.45 total pigs. The variation among technicians ranged from 12.53 to 14.82 pigs/litter.
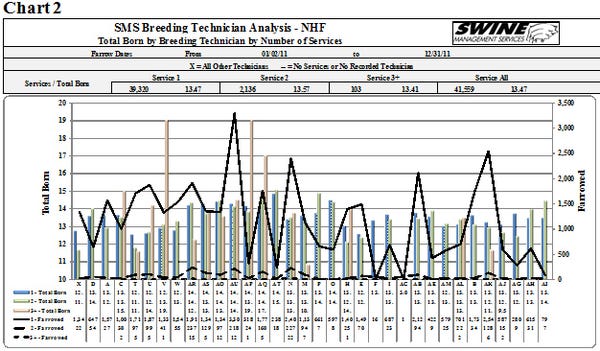
Using this report, we found a farm where the technician doing most of the breeding was averaging one less pig born/litter. To address the variation, we reviewed the breeding procedures on the farm to see if total born could be improved.
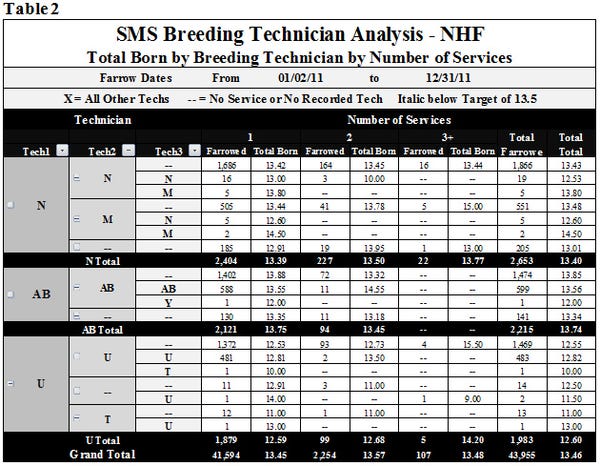
In Table 2, the data is broken out by Tech 1, Tech 2 and Tech 3 by number of services. On first service, when Tech N inseminated twice, the total born was 13.43 pigs/litter compared to Tech U, who mated twice and had a total pigs born/litter average of 12.53 pigs. The 0.90 pigs/litter difference is significant as it represents 1,235 fewer pigs from the 1,372 farrowings by Tech U for the 52-week period.
Over the past year, we have been testing this program on several farms and learning how to use it as a tool to help improve breeding technician performance. We have worked on training all technicians on a farm, changed protocols as needed, and have seen positive improvement. In several instances, after training and protocol changes did not result in improvement, we moved the good employees to other areas of the farm and trained new breeding technicians.
We are constantly looking for new ways to analyze data and present it in new ways to make it easier for farm employees to see and understand problem areas. Then, we offer new ideas on how to manage the increasingly high-producing females they have to work with.
Key Performance Indicators
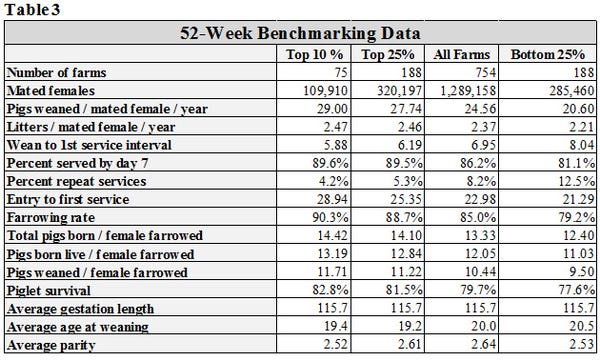
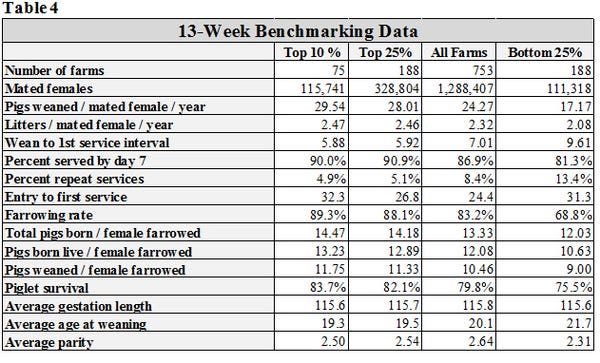
Tables 3 and 4 (below) provide 52-week and 13-week rolling averages for key performance indicators (KPI) of breeding herd performance. These tables reflect the most current quarterly data available and are presented with each column. The KPI’s can be used as general guidelines to measure the productivity of your herd compared to the top 10% and top 25% of farms, the average performance for all farms, and the bottom 25% of farms in the SMS database.
If you have questions or comments about these columns, or if you have a specific performance measurement that you would like to see benchmarked in our database, please address them to: [email protected]or [email protected].
You May Also Like
Enter a zip code to see the weather conditions for a different location.


