Subscribe to Our Newsletters
National Hog Farmer is the source for hog production, management and market news
Swine Management Services offers a checklist to minimize variation in production between farrowing rooms.

Some farms are fortunate enough to have identically sized farrowing rooms with identical equipment in them, while other farms have obvious differences between rooms. If you have identical rooms do you have the ventilation set the same for all rooms? Do you get equal performance from all the rooms?
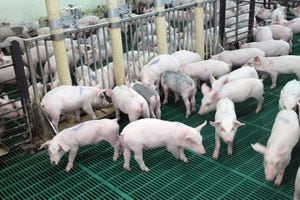
A client recently shared some data with us from their farrowing, a 5,000-plus sow unit with 16 rooms. (Picture 1) The farrowing section is 600 feet long and 128 feet wide. A lot of space and distance for the farrowing team to cover. They wanted us to help them look at the variation in performance by room and with their permission we are taking a look at that in this column, taking into account nearly 8,000 farrowings since March 1 of 2018.

Total born numbers are graphed in Chart 1. The blue bars represent the rooms on the north side of the barn while the red bars are the south side rooms. The x-axis is labeled with room numbers, 1.16 represents Room 1 (north side of the barn) and Room 16 (south side of the barn) across the hall from each other. This is an immature farm with average parity of each room at about 1.75. In theory, total born shouldn’t be impacted by farrowing room but the previous lactation can impact subsequent performance, this could explain some of the variations.

Chart 2 looks at the percent of stillborns by room. The rooms toward the middle of the barn have lower stillborn levels. Is this because of the proximity to the office and medication room? Or is it the technicians in Chart 3 that range from 3.6% to 7.9%, all with over 100 litters on only Parity 2 females.


Chart 4 shows that the further into the barn the higher the piglet survival. Room 1 and 16 at the west end of the barn get the most unregulated air because of it being on the west end and not having any protection like Room 8 and 9 have on the other end of the barn. Chart 5 shows just the third quarter performance, and the thing that jumps out there is Room 11 performance being inconsistent with the Room 6 on the north side of the barn or the overall piglet survival for the farm.


The farm also struggled throughout the summer with getting enough water to the west end of the barn for the cool cells to run consistently, which could have impacted both lactation intake and therefore milk production as well as subsequent total born. When looking at individual rooms there was no significant difference in the performance by row of crates with each room having six rows.
Finally, Chart 6 looks at the number weaned by room. All rooms had less than a one-day variation in wean age which was not a factor in any of the numbers. Number weaned varied from 10.6 to 11.9 pigs per sow. The question is how much can be done from a management perspective to reduce that now that the farm is aware of it. How much variation do you have between rooms? Have you ever done the numbers?
What can be done to minimize the variation?
1. Set the ventilation of each room for the individual room. For example, at this farm, the way Room 1 is set on the northwest corner of the barn would be different than the way Room 9 is set on the southeast corner. Room settings need to be set for the sows and the pigs, not for people comfort.
2. Communicate and train. Communicate the importance of consistency and observations. Training team members to be able to make adjustments to ventilation, attending farrowings and Day 1 pig care to optimize performance and efficiency.
3. Have all the needed supplies on a cart or in a box to easily move from room to room and ensure that adequate supplies are in the room to prevent wasted time going back and forth between the office and rooms.
4. When farrowing at both ends of the barn, make sure you have extra staff available so that sows continue to be monitored every 20 to 30 minutes.
5. Make sure the ventilation system is set for each season and be ready before the temperature changes. Example is getting the cool cell systems set up and running in May. When cool cells are running they need to be checked weekly for water flow and blockage of cells.
Table 1 provides the 52-week rolling averages for 11 production numbers represented in the Swine Management Services Production Index. The numbers are separated by 90-100%, the 70-90%, the 50-70%, the 30-50% and the 0-30% groups. We also include the 13-weeks, 26 weeks and 12-quarter averages. These numbers represent what we feel are the key production numbers to look at to evaluate the farm’s performance.

At SMS, our mission statement is to provide “Information solutions for the swine industry.” We feel with the creation of different SMS Benchmarking databases for all production areas we now have more detailed information to share with the swine industry. If your farm would like to be part of the SMS Benchmarking databases, or if you have a specific performance measurement that you would like us to write about, contact Mark Rix, Ron Ketchem or Valerie Duttlinger.
We enjoy being a part of the National Hog Farmer team. Previous columns can be found at NationalHogFarmer.com.
You May Also Like
Current Conditions for
60°F
Mostly Cloudy
Day 68º
Night 51º
Enter a zip code to see the weather conditions for a different location.