Subscribe to Our Newsletters
National Hog Farmer is the source for hog production, management and market news
Weaning larger litters consistently from P1 females starts with properly managing gilts.
December 7, 2015

Last month we looked at the effect of weaning at age on all parities as it related to wean-to-first-service interval and subsequent total born per litter. The conclusion was as weaning age goes up weaned females have lower wean-to-first-service intervals and that increased total born on subsequent litter. So we wanted to look into more detail at the effect of weaning age, farrowing rate and total born for individual Parity 1 females.
The data we used was 15 farms that have 25,501 females with very good data. These farms averaged 26.68 pigs weaned per mated female the last 52 weeks, 2.42 litters per mated female, 87.8% average farrowing rate, 5.81 days wean-to-first-service with 92.0% of weaned sows bred by day 7, 14.16 total born, 0.95 stillborns, 11.04 pigs weaned per female, 13.8% pre-weaning mortality, 6.7% female death loss and 54.8% gilt replacement rate. There were a total of 71,745 individual sow records used.
In Table 1 Total Farrowing-Parity 1, there were a total of 17,155 farrowings from parity 1 female. To show the distribution of the P1 females in the table it has the X-axis broken out by wean-to-first-service interval: 0-3, 4, 5, 6, 7-9, 10-22, 23-29, 30-63 and 64+ days to cycle after weaning. The Y-axis is broken out by previous lactation length (weaning age): 0-13, 14, 15, 16, 17, 18, 19, 20, 21, 22, 23-24 and 25+ days that sows were lactated. The table shows a lot of variation in weaning age (previous lactation length) and wean-to-first service days. Only 54.8% were weaned between 18 and 21 days, 24.3% at 17 days and less and 20.9% day 22 and up. That alone helps explain why there is so much week-to-week difference in wean-to-first-serve interval, farrowing rate and total born. There was 78.1% of the P1 females bred day 0-6 and 7.9% bred after day 23 of weaning. 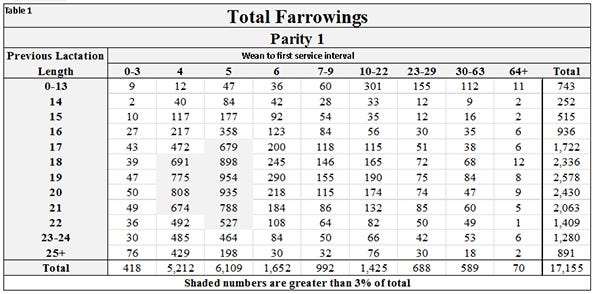 Table 2 Farrowing Rate-Parity 1 shows data broke out by farrowing rate percentage. The table shows as weaning age goes up so does farrowing rate with 18 days being the breaking point. Also as wean-to-service interval goes up farrowing rate goes down with the highest numbers being P1 females bred by day 6. The sweet spot was weaning age from 18 to 21 days and bred by day 6 after weaning. The highest farrowing rates were weaned sows bred days 0-3 at 18-21 days weaning age. This shows that weaned sows bred by day 3 are fertile and should be breed. Also heat checking and boar exposure needs to start day of or after weaning.
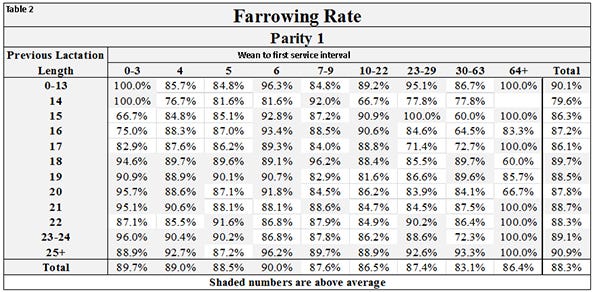
We placed Table 3 Total Born / Female-Parity 1 in to look at the effect of weaning age (previous lactation length) and wean-to-first service have on total born per female. As you can see in Table 3, as wean-to-first service goes up from 0-3 to 7-9 days to cycle total born goes down, and at 10+ days numbers go back up. You will notice a large jump for weaned sows bred days 23+ which are probably sows that have had at least one skipped heat before breeding. In some farms we know that some P1 females are skipped as a management decision or in most cases just missed in heat and found 21+ days later. In looking at previous lactation length (weaning age) the longer the lactation length the higher the total born goes.
So why don’t farms wean older if it increases total born? The problem is farms would need more farrowing crates and litters per female would go down. You need to do the math to see if the investment and reduction in production merits a small increase in total born. The data show that by getting weaned sows to cycle sooner in that range of 18-21 days is the key.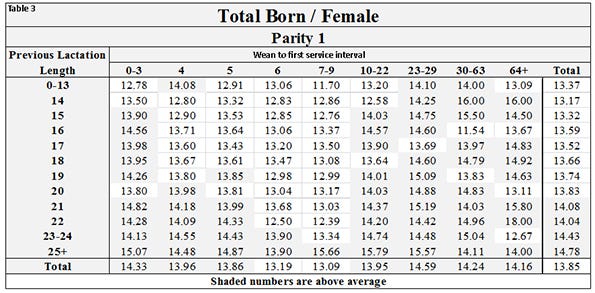
To put this information in a more visual format we created Charts 1 to 4. Chart 1 " Farrowing Rate versus Wean to first Service Interval" is broke out by Parity 1 (blue line), parities 2, 3 and 4 (red line) and Parity All (green line) as Wean to first service goes up all cases farrowing rate drops. 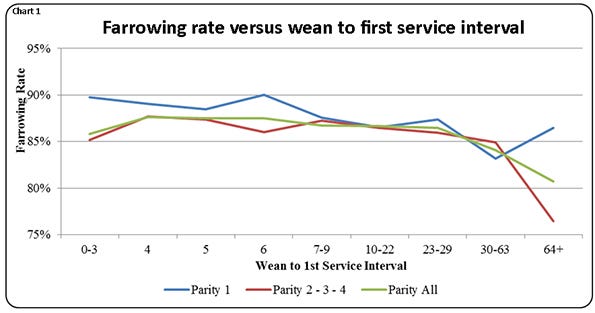
Chart 2 "Farrowing Rate versus Previous Lactation Length," the X-axis is previous lactation length you see improving farrowing rate as previous lactation length goes up with 18 days being the minimum weaning age. 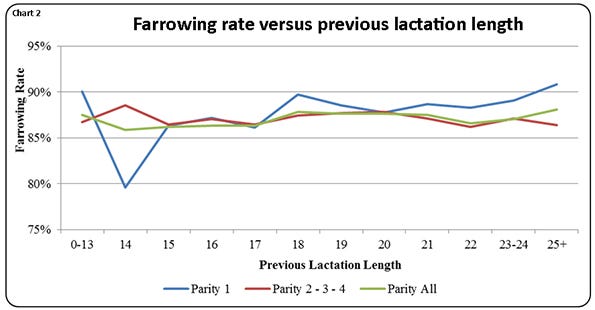
Chart 3, "Total Born versus Wean to first Service Interval" has the X-axis as wean to first service interval. There is a drop in total born as wean-to-first service goes up until you get to sows taking 23+ days to cycle. Most of these sows probably have had a heat cycle before being breed. 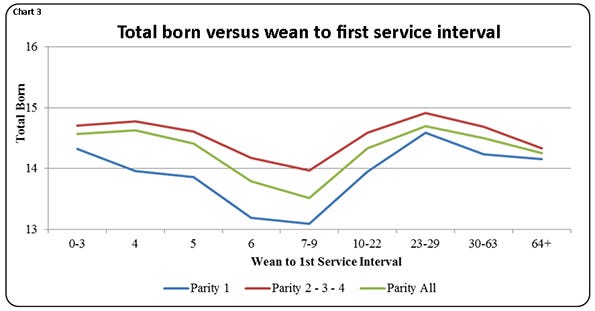
Chart 4, "Total Born versus Previous Lactation Length" has previous lactation length on the X-axis shows as previous lactation length goes up so does total born. 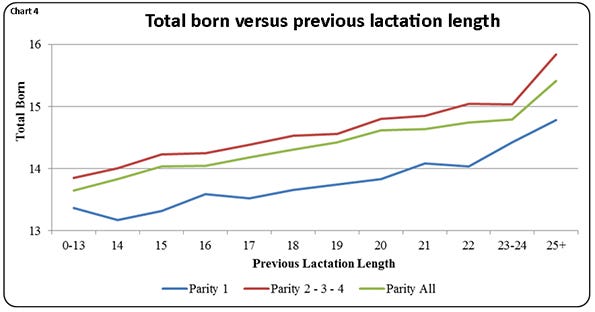
So what are farms doing to get weaned P1 females to wean a large litter and return to heat fast? It starts in the Gilt Developing Unit where the gilts are grown out, exposed to stimulation boars, heat checked daily to find them in heat, recording heat cycles, give gilts exposure to a gestation crate before breeding and then make sure gilts weigh at least 300+ pounds at breeding. Some of this may be done at the sow farm based on the layout. Key for gilts is at least one recorded skip heat, crate exposure for 10+ days and weight at 300+ pounds at breeding. Next area to improve performance is maximizing feed intake in lactation and after weaning. Make sure she is on full feed with females eating 8+ pounds per day from weaning to breeding. If you are able to separate P1 females from the rest of the lactation sows and feed a more dense higher energy lactation diet it will pay you back in improved production numbers.
In summary, there is a lot of farm-to-farm variation in weaning age and especially within the farms. Each week when you are weaning you need to make sure there is a minimum weaning age you want all females weaned at, make gilt development a priority and make sure sows in farrowing are being full fed so they are coming into heat sooner.
Table 4 provides the 52-week rolling averages for 11 production numbers represented in the SMS Production Index. The numbers are separated by 90-100%, the 70-90%, the 50-70%, the 30-50% and the 0-30% groups. We also included the 13-week, 26-week and 12-quarter averages. These numbers represent what we feel are the key production numbers to look at to evaluate the farm’s performance.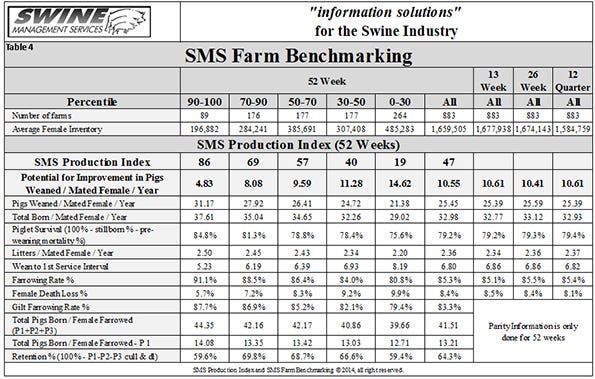
At SMS, our mission statement is to provide “Information solutions for the swine industry.” We feel with the creation of different SMS Benchmarking databases for all production areas we now have more detailed information to share with the swine industry. If your farm would like to be part of the SMS Benchmarking databases, or if you have suggestions on production areas to write columns about, please email or call us. We enjoy being a part of the National Hog Farmer Weekly Preview team.
If you have questions or comments about these columns, or if you have a specific performance measurement that you would like us to write about, please contact [email protected] or [email protected].
You May Also Like
Enter a zip code to see the weather conditions for a different location.


