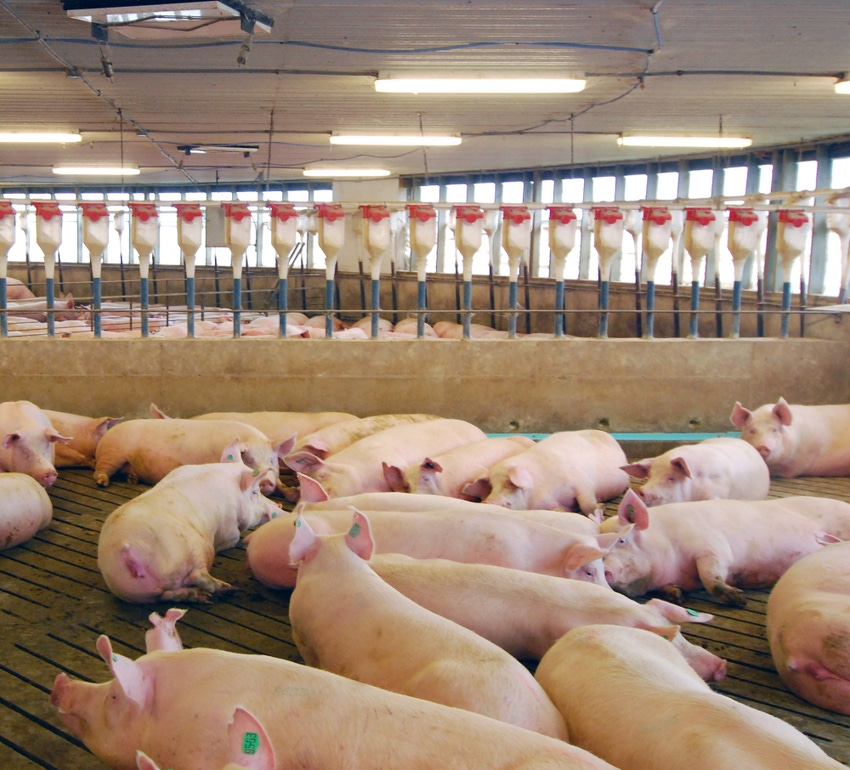
Have you done a review of how replacement gilts are brought into the farm, the nutrition program they are on and the selection process for the best gilts?
November 3, 2022

As mentioned in the last article, "Looking in depth into female culling and death loss," the swine industry continues to see increasing female death loss and culling. That article focused on using six categories for culling and death loss with data broke out by parity for farm analysis.
In summary, from that article with 36 months of data from MetaFarms, 49.8% of all females culled were P0-P2 females with culling for reproduction (pig/preg check negative, abortion, repeat service, vaginal/uterine prolapse, failed to farrow, open no-heat) being 37.6% of all culls, with 11.0% being P0 females. When looking at female death loss (euthanized), 51.6% of all deaths were younger P0-P2 females with main reason for deaths being locomotion (unsound, lame/injured, feet infection, injured foot or dew claw) showing 8.8% of all deaths and 44.3% of all females euthanized being from locomotion.
In this article, plans are to look deeper at culling. The data set from MetaFarms was used with cull data from Oct. 1, 2020, to June 30, 2022, which included data from 936,762 females removed. Due to some bad data, there were 19,315 sows removed that were culled after 241+ days on the action list which made up 1% of all the females used in the charts. As a side note, data integrity is important with one sow in the data set for 12,054 days before removal. This sow was in a 1,000 head sow farm which increased average non-productive days by 12.04 days from 45 to 57.04 day if left in the farm data.
For the charts below, data from 917,447 females was used broke out by parity from P0-P7+, the six culling/death loss categories were: intestinal, other, reproduction, locomotion, disease/health and performance, last event before culling being: mating, arrival, treatment, abortion, farrowing/lactating, wean and open, and days to removal after last event broke into days: 0-30, 31-60, 61-90, 91-120, 121-150, 151-180, 181-210, 211-240 and 241+ days.
Chart 1: Percent Culls by Parity and Last Event has data from MetaFarms for last 21 months ending June 30, 2022. Chart 1 is set up with parity 0-7+ on the X-axis, and percent removed by culling on Y-axis with data broke out by last event before culling which are: mating, arrival, treatment, abort, farrowing/lactating, wean and open. Culling data from 917,447 removals was used with breakdown of all removals being 18.9% P0, 17.9% being P1, 11.3% being P2 with 48.1% of all culls being younger P0-P2 females. What is concerning is only 9.9% and 13.2% were the older P6 and P7+ females?
Chart 1 shows that for arrivals (orange line) 88.7% of the females culled were P0's with the rest probably older parity females transferred to farm either bred or open, treatment (gray line) shows that 38.4% of females treated before culling were P0 females, 16.3% were P1’s, 9.4% P2 and 9.2% P7+, and farrowing/lactating (light blue line) showing 21.5% of these females culled were P1, 12.0% P2, and 22.1% being older P7+ females. Main take away is 48.1% of all culled sows were P0-P2 females with 64.1% removed after a treatment.
Chart 2: Percent Culls by Reason and Last Event is set up with the six categories for culling: intestinal, other, reproduction, locomotion, disease/health and performance on the X-axis and percentage on the Y-axis is broken out by last event: mating, arrival, treatment, abort, farrowing/lactating, wean and open. The six categories were broken out in reasons for each one in the last article published on National Hog Farmer on Oct. 4, if you want to look them up.
When you view Chart 2, culling by reproduction jumps out with 34.0% of all culling being in that category with last events being broken down showing 48.0% of all mating (blue line), 49% of all arrival (orange line), 54% of all treatment (gray line), 68.0% of all other (black line), and 66% of the abort (yellow line). With most data sets, there is a high percent of other being used to categorize females being culled or deaths (euthanized). In this data set, 25.0% of the females were category other with no reason for culling and 35% of the culling by category performance. It is becoming even more important that all reasons for removal are recorded for more accurate analysis.
Chart 3: Days to Cull Parity and Last Event is set up different to show average days from last event on Y-axis going from 10-80, X-axis broken out by parity P0-P7+ and data broken out by last event before culling. Mating (blue line) showing that days to cull after mating is very high with range of P0 at 78.37 days down to P6 at 66.68 day with average days to culling high at 71.98 days, arrival (orange line) shows P0's removed averaged 68.86 days, Treatment (gray line) showing P0's at a high 62.0 days down to P7+ at 25.78 days with overall average for removals at 33.91 days for 917,447 females culled over the last 21 months ending June 30, 2022.
With all these extra open sow days, especially after females are mated, what is going on at some of the farms looking for returns with heat check boars and using pregnancy checkers? Is this caused some by the labor shortage at some farms that do not have enough staffing to perform these tasks?
Chart 4: Average Days to Cull by Categories and Last Event is set up putting the six categories for culling on the X-axis and the Y-axis being average days before being removed broke out by the last event recorded for the female before removal. When reviewing what the chart is showing, the last event mating (blue line) stands out with average days after mating's to removal being 73.34 days with culled females categorized as Intestinal taking an average of 99.62 days before being culled. When you look at treatment (gray line), the average days to cull at treatment is at 40.71 days and wean average days to remove is at 20.18 days. Why are farms waiting so long to look for returns after mating?
Chart 5: Percent of Culls by Parity and Days again is the same data set from MetaFarms set up with X-axis having break out in days of removal: 0-30, 31-60, 61-90, 91-120, 212-150, 151-180, 181-210, 211-240 and 241+ days. The Y-axis is set up with percent going from 0-90% with data break out by parity going from P0 to P7+. Chart shows that 67.9% of all removals were in the 0–30-day range with 40.2% of all P0's in that range of 0-30 days with another 15.7% being removed days 31.60 which puts 55.9% of all culled removed by day 60. The other 44.1% of culls took from 61-241+ days.
Why are 10.6% of sow culled found day 91+ before being removed? Probably some of this is due to record keeping with farms removing females from records when female is probably not on the farm anymore or females getting missed during preg-checking, heat checking, or found open being loaded into the farrowing rooms. Some data shows today with high feed costs, high cost for facilities and labor where an open sow day is at $3+ per day. If your 2,500 sow farm is averaging an extra seven open sow days per sow, the yearly cost to the farm is $52,500+.
The final chart, Chart 6: Percent of Culls by Last Event and Days is looking at Y-axis being average days range going from 0-30 to 241+ days with Y-axis showing percent going from 0-90% with cull data broke out by last event: mating, arrival, treatment, abort, farrowing/lactating, wean and open. The chart shows that event open (black line) shows that 80.3% of the removals were day 0-30 with another 12.9% removed by day 60, farrowing/lactating (light blue line) shows that 81.5% were culled by day 30 and 12.8% by day 80, and wean (green line) shows farm culling 81.0% days 0-30 with another 12.9% days 31-60, and abort (yellow line) 71.1% were removed days 0-30 with another 21.5% days 31-60. Remember that overall days to cull females is at 33.91 days.
With this large database of 936,762 sows culled-removal in a 21-month period starting October 1, 2020, and ending June 30, 2022, it is very interesting to see average days to cull being 33.91 days with one female in data up to 12,054 days. Keeping farm data current and accurate should be a priority at all farms. When cleaning up your data for missing sows, please remove females within 60 days of their last event and use a reason such as missing, inventory adjustment or not on farm. This will help when analyzing the data in the future.
As was pointed out in previous articles, the younger females are being culled at a high rate with 48.1% in this database being P0-P2 and only 13.2% being the older P7+ females. The category reproduction accounted for 34.0% of all culls with event to removal being highest for mating, arrival, treatment and abort ranging from 48-68%. Days to removal for all females was at 33.91 days with highest for P0 at 58.96 days with event mating at a high of 78.37 days to find open female.
What is your farm doing to find cull females and get them out of the farm sooner to lower open sow days? What are you doing to lower the early exit of the younger females from your farm? Have you done a review of how replacement gilts are brought into the farm, nutrition program they are on and selection process for the best gilts are making their way to the breeding area and staying in the farm longer?
For the next article in December, data will be looking at death loss (euthanized) females in the same detail as was done with culls.
Thank you for reading this article. If you have other topics that you would like reviewed, please let SMS know.
Source: Ron Ketchem (30 & Up Consulting LLC) and Mark Rix (SMS a MetaFarms Company), who are solely responsible for the information provided, and wholly owns the information. Informa Business Media and all its subsidiaries are not responsible for any of the content contained in this information asset.
You May Also Like


