Today most farms are having difficulty just filling the day shift, but it isn’t necessary to add additional staff, just shifting the timing of team members can have a big impact on stillborns.
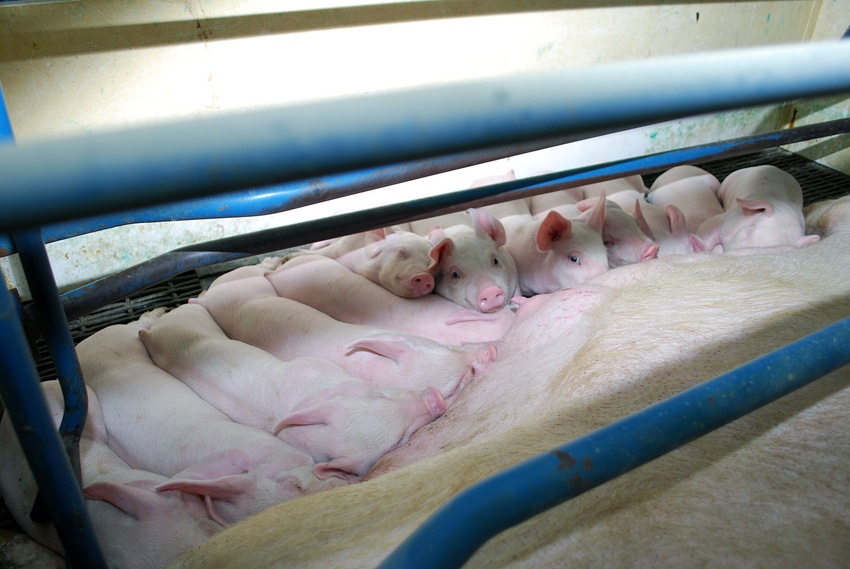
It can be quite frustrating when the farrowing staff has been attending farrowings and everything is going along smoothly with at least one new pig every 15 minutes, and then out comes a stillborn. While eliminating all stillborns is not possible, there is a lot of opportunity to reduce the incidence.
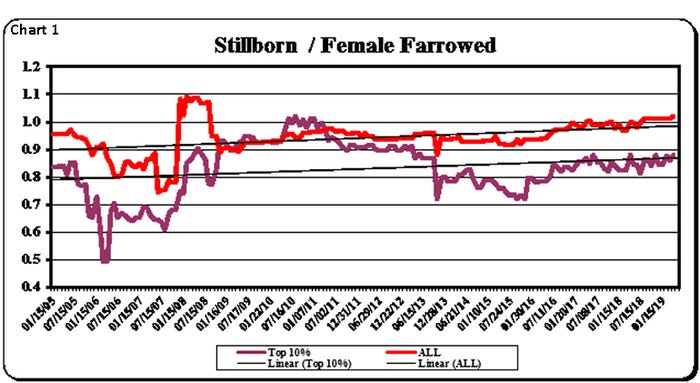
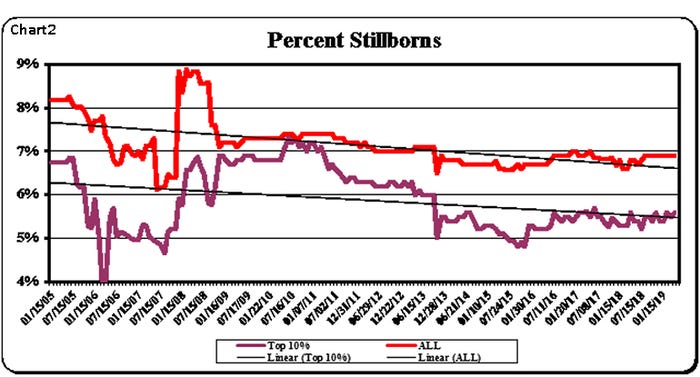
One thing to consider when measuring stillborns is the number you are using to gauge performance, the average number per litter or the percent per litter. In Chart 1, the average number of stillborn piglets per litter for the Swine Management Services database over the last 14 years, that time period shows a slight increase in the number per litter. When you look at Chart 2, the percent of stillborns per litter the trend is lower over the last 14 years. As total born has moved higher, the percent per litter has moved down. As the total born number increases there is an increase in stillborns per litter but that doesn’t have to be as the data show here.
In this column we look at over 410,000 farrowings from 50 farms in a 52-week period. Forty-five percent of the sows contributed to all the stillborns and 20% of the sows contributed to 70% of the stillborns. That 20% of the sows had two or more stillborns per litter.
Most farms regardless of size have “big” farrowing days. In Chart 3 it shows that 34% of the litters are born on Thursday or Friday contributing 34% of the total born and those days contribute 32.8% of the stillborns. Saturday, Sunday and Monday did have a higher percentage of stillborns compared to the total born. Placing the farms into groups based on their farm average of stillborns per litter for the time period, Chart 4 shows that there is little variation by day of the week regardless of how low or high the farm’s average is per litter.
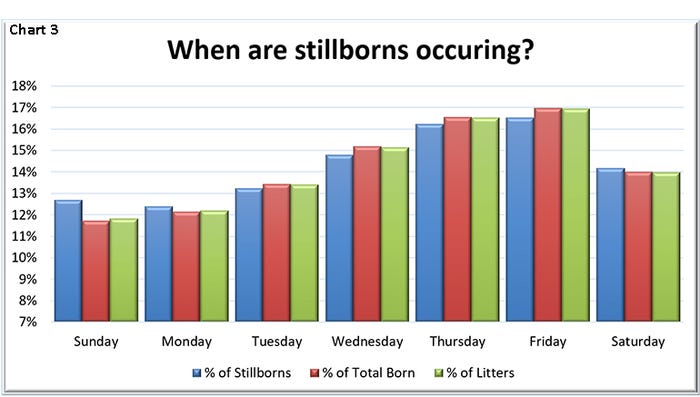
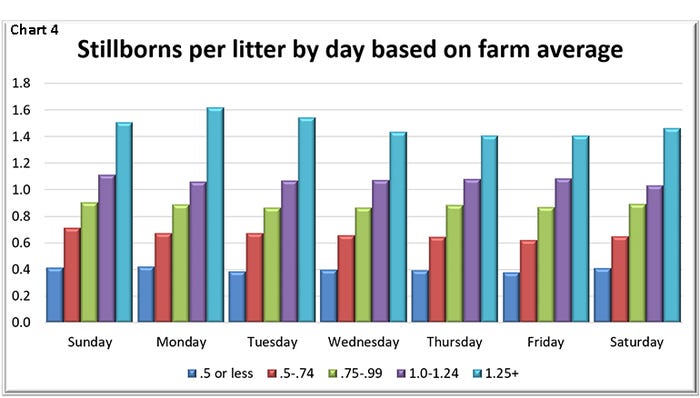
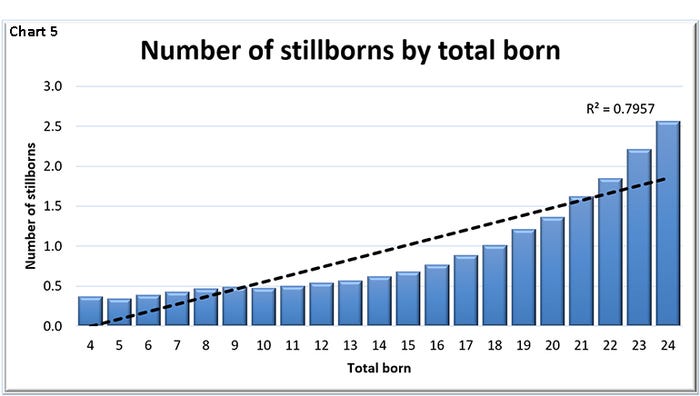
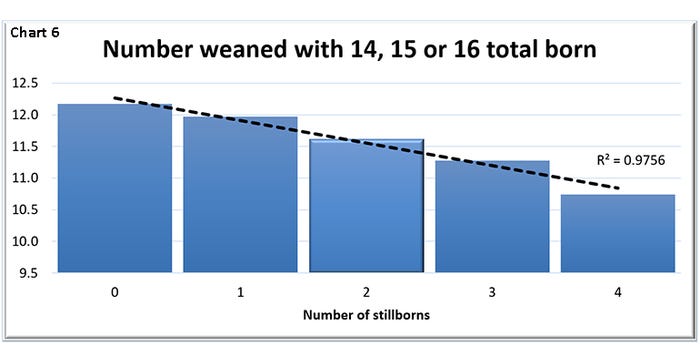
Chart 5 shows that the average number of stillborns per litter goes up by total born. Shown are total born between four and 24, all with 1,000 or more litters. This makes sense, the more pigs she has the longer she is likely in labor and more likely to get tired which increases the time between pigs and increases stillborns. However, if we limit it to a tighter total born range of 14, 15 and 16 representing 9,460 farrowings there is an interesting finding when it comes to number weaned. Chart 6 shows that the number of stillborns a sow has also impacts how many pigs she will wean from this subset of the 50 farms.
The impact that people can have on stillborns is significant. Today most farms are having a difficult time just filling the day shift, but it isn’t necessary to add additional staff, just shifting the timing of team members can have a big impact on stillborns. In Table 1, the impact of extended hours is significant. Thirteen of the farms are covering 16-plus hours per day. Those same 13 farms averaged 31.37 pigs weaned per mated female per year for the last 52 weeks.
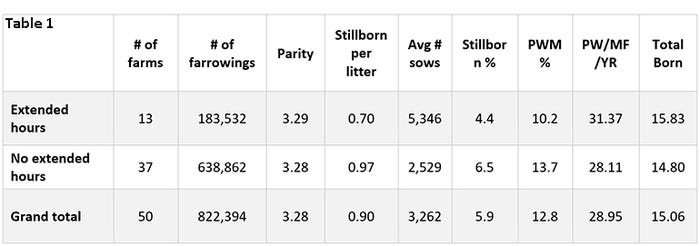
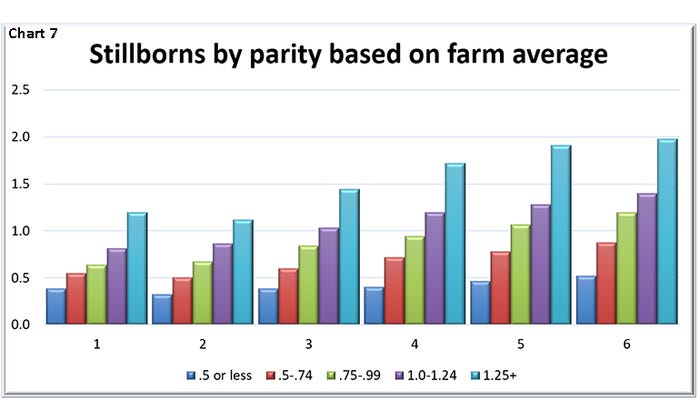
Chart 7 shows that stillborns get higher with each parity. This isn’t new information, but here it shows that this is true regardless of how low the overall farm average is.
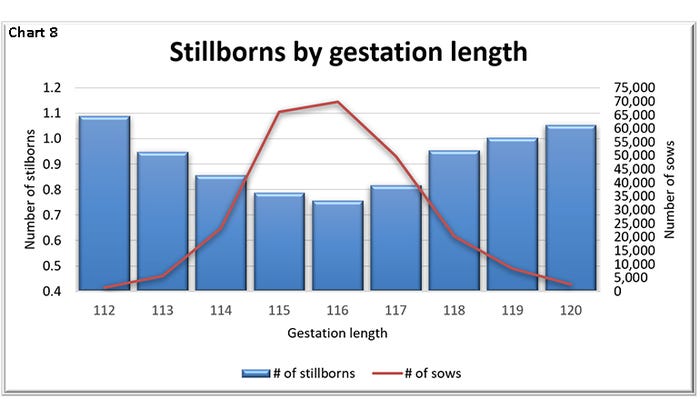
The impact of gestation length on number of stillborn piglets is shown in Chart 8. Those farrowing on Day 116 with the lowest number of stillborns per litter. While those farrowing early and late both are at an increased risk of stillborns.
In research out of Europe by Theil, et al, the timing of the sow eating pre-farrow has an impact on how long it takes her to farrow as well as the number of stillborns per litter. The longer from the last feeding the longer it takes her to farrow. In a recent survey of some of our clients this seems to be the case there as well. Those farms that are ad lib feeding starting when she is penned up had total born of 15.6 and 0.7 stillborns per litter while those farms that started ad lib feeding on the day of farrowing had 14.8 total born and 0.9 stillborns per litter.
Some ideas to consider to help reduce the number of stillborn piglets are:
Identify at-risk sows and monitor more frequently, those that have a history of stillborns and those sows that are Parity 5 or above. Penning them together in the room or flagging them in some way so that no matter where you are in the room you can see that she needs extra help.
Increase the feed available to sows pre-farrow.
Attend a higher number of farrowings; be there to assist the sows as needed.
Limit oxytocin use.
Use induction practices strategically. Inducing the sow to farrow prior to Day 115 can increase the number of stillborns and have a large negative impact on the sow because she really wasn’t ready to start the farrowing process. However, letting sows go too long can create an increased number of stillborns as well.
What is your farm doing to lower stillborns? These are usually larger pigs that should be in the live bucket.
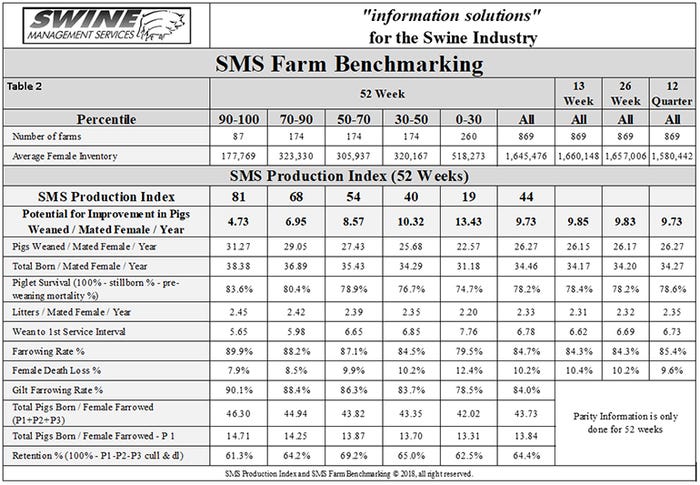
Table 2 provides the 52-week rolling averages for 11 production numbers represented in the SMS Production Index. The numbers are separated by 90-100%, the 70-90%, the 50-70%, the 30-50% and the 0-30% groups. We also included the 13-week, 26-week and 12-quarter averages. These numbers represent what we feel are the key production numbers to look at to evaluate the farm’s performance.
At SMS, our mission statement is to provide “Information solutions for the swine industry.” We feel with the creation of different SMS Benchmarking databases for all production areas we now have more detailed information to share with the swine industry. If your farm would like to be part of the SMS Benchmarking databases, or if you have suggestions on production areas to write columns about, please contact Mark Rix, Ron Ketchem or Valerie Duttlinger. We enjoy being a part of the NHF Daily team. Previous columns can be found at NationalHogFarmer.com.
Sources: Ron Ketchem, Mark Rix and Valerie Duttlinger, Swine Management Services LLC, who are solely responsible for the information provided, and wholly own the information. Informa Business Media and all its subsidiaries are not responsible for any of the content contained in this information asset.
About the Author(s)
You May Also Like
