Different herd health statuses, vitamins and trace mineral sources, and diet formulation with a margin-of-safety mindset reflect the huge variation.
September 8, 2022

Vitamins and trace minerals are added to swine diets to contribute to the animal's health, performance and well-being. Depending on the production phase or stage, pigs require different amounts of each vitamin and trace mineral, and some of those are closely involved in reproductive functions.
Most gestation and lactation diets are formulated well above the National Research Council (NRC, 2012) requirement estimates for two main reasons. First, nutritionists want to maintain a margin of safety to account for potential reductions in the bioavailability of vitamins resulting from unfavorable storage conditions or excessive storage time. Second, this area has traditionally little research, resulting in a lack of knowledge.
Six years ago, nutritionists for 2.3 million sows were surveyed and confirmed that in the U.S. vitamin and trace mineral concentrations are frequently higher than the NRC estimates. Additionally, the survey showed considerable variation in the levels used by different swine operations. This variation might be attributed to differences in health status, vitamin and trace mineral source, feed mill characteristics, or nutritionists' opinions as to a margin of safety.
Furthermore, in 2018 there were vitamin shortages that resulted in some vitamin inclusion rates being reduced, and it is not clear if the resulting supplementation rates remained or were again increased after the vitamin supply became adequate. Because it has been six years since the last U.S. survey and 10 since the previous NRC publication, our goal was to update the vitamin and trace mineral concentrations used and survey a greater portion of the industry than in 2016.
The survey procedures followed the same methods as Flohr et al. (2016). Nutritionists from swine production companies in the top 40 Pork Powerhouses list and nutrition supplier companies were contacted via email or phone from November 2021 to February 2022.
The survey aimed to identify industry levels of added vitamins and trace minerals in complete gestation and lactation diets. The vitamins and trace minerals of interest included: vitamin A, vitamin D, vitamin E, vitamin K (menadione), thiamin, riboflavin, niacin, pantothenic acid, pyridoxine, biotin, folic acid, vitamin B12, choline, vitamin C (ascorbic acid), copper, iodine, iron, manganese, selenium, zinc, cobalt, chromium and carnitine.
Results were compiled and pooled to determine descriptive statistics in an Excel spreadsheet. Descriptive statistics used included: average, weighted average (determined by the total number of sows), median, minimum, maximum, 25th percentile (lowest quartile) and 75th percentile (highest quartile). All values were determined using Excel formula functions, including average, standard deviation (STDEV.S), median, minimum (MIN), maximum (MAX) and 25th and 75th percentiles (QUARTILE. EXC). Weighted averages were calculated using the SUMPRODUCT function of Excel, in which the participant vitamin or trace mineral concentration was multiplied by the number of sows and then divided by the total number of sows for all participants that provided added levels for that nutrient. Average vitamin and trace mineral concentrations were compared to NRC (2012) total dietary requirement estimates and to Flohr et al. (2016).
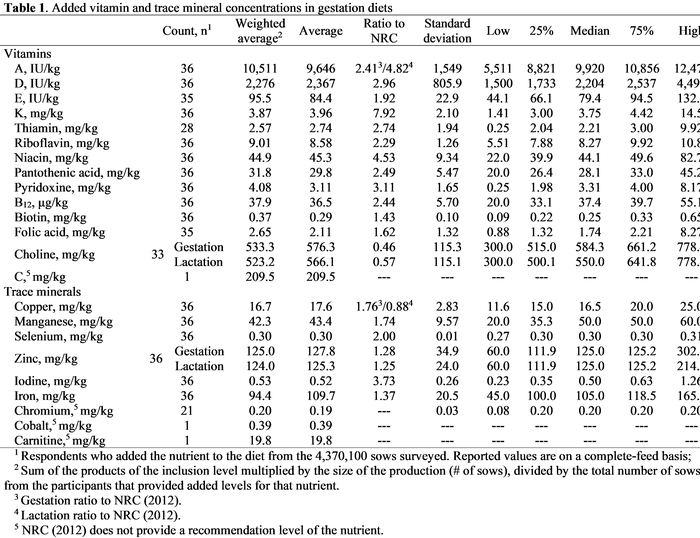
Gestation and lactation diets (Table 1) were provided by 29 production systems and seven nutrition supplier companies totaling approximately 4,370,100 sows, or 72% of the U.S. industry. Fat-soluble vitamins, on average, were 113% of the values obtained by Flohr et al. (2016). Vitamin A supplementation ranged from 5,511 to 12,472 IU/kg, with an average of 9,646 IU/kg representing 2.41 and 4.82 times the NRC (2012) for gestation and lactation diets, respectively. Vitamin D3 supplementation ranged from 1,500 to 4,499 IU/kg, with an average rate of 2,367 IU/kg representing 2.96 times the NRC (2012).

Thirteen of the 36 producers supplied vitamin D through 25-Hydroxyvitamin D3 as a source or a percentage of the supplied (Table 2). Vitamin E supplementation ranged from 44.11 to 132.3 IU/kg, with an average rate of 84.4 IU/kg representing 1.92 times the NRC (2012). Eight of the 36 respondents specified natural vitamin E as a potential source of vitamin E. Vitamin K was supplemented at a range of 1.41 to 14.5 mg/kg with an average rate of 3.96 mg/kg representing 7.92 times the NRC (2012). Water soluble vitamins, on average, were 103% of the values obtained by Flohr et al. (2016).

Thiamin was supplemented by 28 of the 36 producers at a range of 0.25 to 9.92 mg/kg, with an average of 2.74 mg/kg representing 2.74 times the NRC (2012). Riboflavin, niacin and pantothenic acid were supplemented at ranges of 5.51 to 10.8 (average of 8.58 mg/kg), 22.0 to 82.7 (average of 45.3 mg/kg), 20.0 to 45.2 mg/kg (average of 29.8 mg/kg), respectively. Pyridoxine ranged from 0.25 to 8.17 mg/kg, with an average of 3.11 mg/kg, representing 3.11 times the NRC (2012). Vitamin B12 was supplemented at a range of 20.0 to 55.1 μg/lb with an average of 36.5 μg/lb, representing 2.44 times the NRC (2012). Biotin and folic acid were supplemented at ranges of 0.09 to 0.65 mg/kg (average of 0.29 mg/kg) and 0.88 to 8.27 mg/kg (average of 2.11 mg/kg). Choline was supplemented at a range of 300.0 to 778.4 mg/kg with an average of 576.3 and 566.1 mg/kg representing 0.46 and 0.57 times the NRC (2012) for gestation and lactation diets, respectively. One producer supplemented vitamin C at a rate of 209.5 mg/kg.
Trace minerals, on average, were 104% of the values obtained by Flohr et al. (2016). Copper was supplemented at a range of 11.6 to 25.0 ppm with an average of 17.6 ppm representing 1.76 and 0.88 times the NRC (2012) for gestation and lactation diets, respectively. Thirteen of the 36 respondents supplemented a percentage of Cu from an organic or chelated source. Manganese was supplemented at a range of 20.0 to 60.0 ppm with an average rate of 43.4 ppm representing 1.74 times the NRC (2012). Thirteen of the 36 respondents supplemented a percentage of Mn from organic or chelated sources. Selenium was supplemented at a range of 0.27 to 0.31 ppm with an average of 0.30 ppm. Twenty-three of the 36 producers supplied a percentage of the added Se from organic or chelated sources. Zinc was supplemented at 60.5 to 302.0 ppm with an average rate of 127.8 and 125.3 ppm representing 1.28 and 1.25 times the NRC (2012) for gestation and lactation diets, respectively. Twelve of the 36 respondents supplemented a percentage of the Zn from organic or chelated sources. Iodine and iron were supplemented at ranges of 0.23 to 1.26 ppm (average supplementation rate of 0.52 ppm) and 45.0 to 165.0 ppm (average supplementation rate of 109.7 ppm). Twenty-one producers supplemented chromium at a rate of 0.19 ppm. One producer supplemented cobalt at a rate of 0.39 ppm, and another supplemented 19.8 mg/kg of carnitine in sow diets.
In conclusion, the update of the U.S. current inclusion levels of vitamins and trace minerals in sow diets can be used as an industry benchmark. Different herd health statuses, vitamins and trace mineral sources, and diet formulation with a margin-of-safety mindset reflect the huge variation in some vitamins and trace minerals. In addition, the comparisons to the most recent (2012) NRC version recommendations highlight the necessity of further and fresh studies. Finally, the snapshot provided by this survey might help the development of trials where the goal is a better understanding of the more adequate levels of vitamins and trace minerals in sow diets.
Data regarding all production phases will be discussed more in-depth at the 2022 K-State Swine Industry Day on Nov. 17.
The authors would like to express appreciation to all nutritionists who shared information to help build this survey.
Source: Jamil E. G. Faccin, Mike D. Tokach, Jason C. Woodworth, Joel M. DeRouchey, Jordan T. Gebhardt and Robert D. Goodband, who are solely responsible for the information provided, and wholly own the information. Informa Business Media and all its subsidiaries are not responsible for any of the content contained in this information asset.
You May Also Like


