

Subscribe to Our Newsletters
National Hog Farmer is the source for hog production, management and market news
April 4, 2016

Beware the Hogs and Pigs report! I don’t say that often, but the March version from the USDA has, in my opinion, a few traps in it of which producers need to be aware.
Before I discuss the issues I see and their implications for the hog market, let me be clear on one topic: No USDA report is any better than producers’ responses to the survey on which the report is based. And that is truer of the Hogs and Pigs report than most since the number of producers is much smaller than it once was and many respondents represent a much larger proportion of the total. If anyone reading this column did not respond to the survey or just filled in the numbers or, even worse, intentionally lied, then take a look in the mirror to see a major reason we may not have a clear view of what is ahead for hog supplies.
The USDA, in my opinion, again made a serious error in this report but the hard working and conscientious people there (and I really believe that statement to be accurate — I am not being sarcastic or cynical in the least!) cannot do a good job without good information.
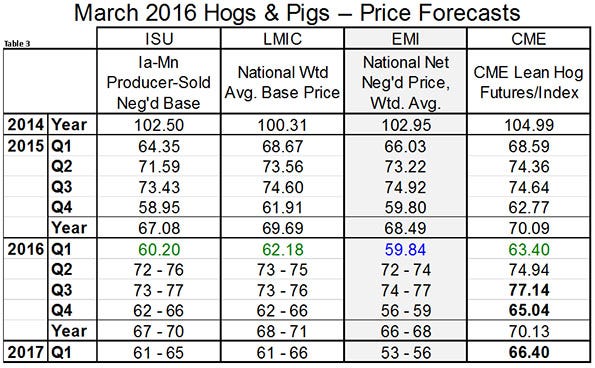
It did not change my expectations for this market much. I still have cash hogs in the mid- to upper-$70s on a carcass basis this summer and in the high-$50s this fall. I did lower my fourth quarter price forecast to $56-$59 (national negotiated net weighted average price) this fall but the others are pretty much the same as in December.
The report itself, though, appears more friendly to deferred hog prices as a number of inventory and production categories were below what analysts expected before the report was released. I am troubled by most of those.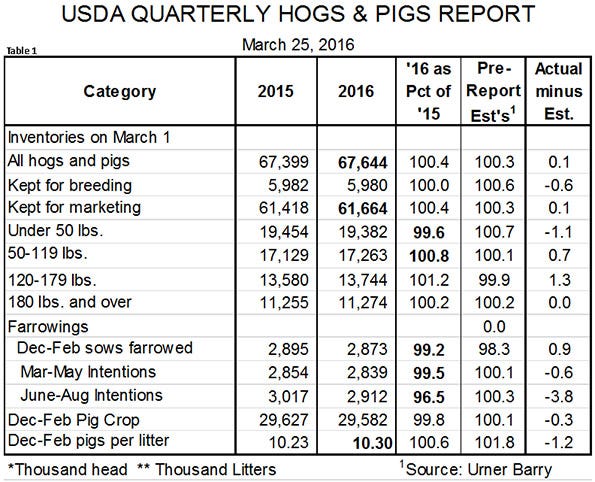
First, the breeding herd was estimated to number 5.98 million, virtually the same as one year ago but 22,000 smaller than on Dec. 1. If that is true, it would be the first time since 2010 in which the herd has fallen from December to March and that decline was at the end of a cost-driven two-year consolidation of the herd that saw it shrink by 7.6% from its December 2007 recent peak. Corn prices had hit $7 in 2008 and the ethanol industry was still expanding rapidly to meet federally mandated usage levels. But where there was a good economic driver of that December to March 2010 herd reduction, I can see little for this one. This year looks to be a profitable year. A number of major players have packing capacity that will need to be filled next year. Why would the herd be reduced this winter?
Further, the state breeding herd data were, at first blush, very hard to understand. Iowa cut 50,000 sows since last March — and since Dec. 1? Minnesota’s herd shrank by 10,000 since last year? Missouri by 15,000 since last March — and 10,000 since December? Indiana by 20,000 from last year and 10,000 since December? I know of expansions in all of those states and would be surprised if enough sows left the industry after recent profitable years to offset the expansions by that much. It is possible (and maybe likely) that the sale of sow farms by Christensen Farms to Seaboard Foods was not accurately reflected in the Iowa inventory. If so, it explains much of the big reduction in the report but it would mean the reduction is still wrong and the Iowa herd is still understated. No size was announced for the Christensen-Seaboard transaction but we understand that it was about half of the 50,000 change. That still leaves a 25,000 reduction in Iowa since December and that still sounds very large to me. If the sows did not get reflected well, what about the market hog inventories, most of which are in finishing barns in Iowa?
The December-to-February average pigs saved per litter, 10.30, represents the largest decline from September-to-November (-.232 pigs per litter) since 1979 except, of course, for 2014 when porcine epidemic diarrhea virus wreaked its havoc. While porcine reproductive and respiratory syndrome virus has been more of a problem this year, PEDV has been less of an issue than expected and I can see no reason that litter sizes would have fallen this sharply.
That means the December-February pig crop is — like most others recently — understated and that means the under-50 pound inventory is also understated. The “normal” litter size change from September-to-November to December-to-February over the period 2007-13 (i.e. the most recent impressive uptrend and before PEDV) would put the December-to-February figure at 10.48, the December-to-February pig crop at 30.1 million (assuming USDA’s December-to-February farrowings are accurate). That would be 1.6% larger than last year, not 0.2% smaller.
The most bullish number in this report is June-to-August farrowing intentions at 96.5% of one year ago, 3.8% lower than the average of analysts’ pre-report estimates. The reason for that big drop is that the USDA revised its June-to-August 2015 farrowings upward to account for its upward revision of the June-to-August pig crop which, when compared to December-to-February slaughter, proved to be too low. Revising the pig crop is fine. We all need a historically accurate inventory and production data set. But accounting for the entire change in the pig crop with more litters — instead of allowing that litters may have been larger — is very likely wrong. The upward revision of 2015 number means the denominator in our 2016 year-ago calculations is larger meaning the percent of last year number looks smaller than it actually is. Ignore the percent change number and focus on the 2.912 million litters expected this year.
Lastly, and in no way the fault of the Hogs and Pigs report, we once again have to account for the growing number of pigs coming from Canada. I don’t expect there to be a flood but imports of Canadian feeder pigs grew by 10% last year. Imports of Canadian market hogs grew by 65% in 2015 but that number was pushed artificially higher by labor disputes in Quebec the spring of 2015. Quality Meats’ bankruptcy pushed some hogs southward but the lack of shackle space in Ontario will remain a factor this year. We expect imports of those two classes to increase by 9% (350,000 head) and 27% (160,000 head) this year as mandatory country-of-origin labeling is no longer causing U.S. packers headaches when they use Canadian-born pigs. Those hogs will increase U.S. slaughter by about 0.4%.
This summer will be fine. It looks like the highs may be in for summer futures but you can still lock-in mid- to upper-$70s, or better, for cash hogs if you haven’t already done so. October futures of $67 and $62 for December still look much better than my forecasts for fourth quarter hogs. Likewise for $65 February 2017 Lean Hogs futures as I think the first quarter of next year cash hogs will be no higher — and possible lower — than the fourth quarter of this year. A 1% larger breeding herd this year producing 1.9% larger litters (the average since 2007, omitting the PEDV quarters) and more Canadian pigs will put next year’s supplies 2 to 3% higher than this year’s.
New packing capacity next summer will help but it only helps get the hogs converted to pork — which still must be sold. Do not fret, it will all be sold. But at what price? I still see 2017 as roughly breakeven given today’s cost levels, but any little problems will be hard to overcome given what I think is the true supply situation and production outlook. My supply and price forecasts as well as those of Iowa State University and the Livestock Marketing Information Center appear in Tables 2 and 3. 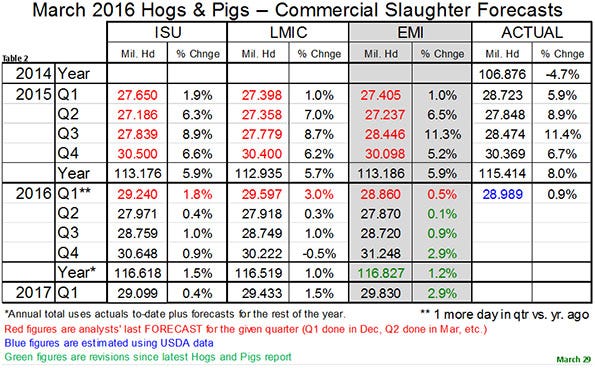
You May Also Like
Current Conditions for
46°F
Mostly Cloudy
Day 56º
Night 46º
Enter a zip code to see the weather conditions for a different location.


