So will demand return to pre-2021 levels or bounce upward once again? That’s a good question at present.
December 14, 2021
October’s real per capita expenditures (RPCE) for pork indicate continued strong consumer-level demand – but there are a few storm clouds that bear watching.
RPCE is a figure that reasonably represents the level of demand for pork. Demand, as you likely recall, is not just consumption and not just price but a combination of the two. In the textbooks, demand is defined as the quantities of a good that buyers are willing and able to purchase at alternatives prices. Notice that both facets – quantities and prices – are plural meaning that demand is a set of quantity-price pairs. Further, logic (and a lengthy theoretical proof that, trust me, you don’t want to read or otherwise experience!) tells us that these factors are negatively related. That relationship is captured by the elasticity of demand which measures the sensitivity of purchase quantities to prices.
Using RPCE captures this negative relationship by multiplying the two factors together. If quantity goes up and prices do not fall much RPCE indicates that demand has strengthened. Likewise with higher prices and only a small reduction in quantity. The opposite holds true for both situations.
Pork RPCE for October was up 3.6% from one year ago and brings the year-on-year comparison for January through October to +3.5%. See Figure 1. Note that RPCE is stated in constant 2014 dollars. The base year is chosen arbitrarily. Using real (ie. deflated) prices obviously removes the impact of inflation on the figures and makes the years directly comparable. This year’s Jan-Oct total of $162.42 2014 dollars is record high, breaking last year’s previous record or $156.99. 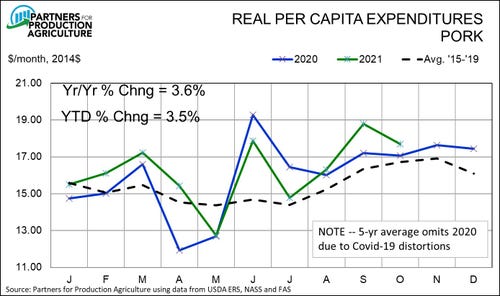
It has been a great and surprising two-year run for consumer-level demand. 2020 RPCE for pork was 3% higher than that of 2019 and broke the previous record set in 2015. 2021 has been more of the same with both years showing some wild fluctuations caused by Covid-19 disruptions to supply chains. See Figure 2. I believe this strength was driven by the changes in food buying practices that were thrust on consumers last year. More shopping in grocery stores allowed a more direct comparison of pork’s value to competitor prices and the new habits may well have a long-term impact on demand.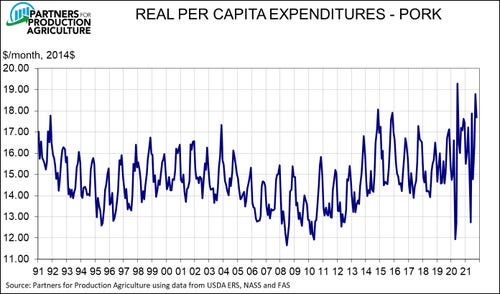
But how long can that impact last? I don’t’ think anyone knows. Strong domestic demand and export demand pushed wholesale demand higher as well and those gains carried cutout values to levels that I did not expect last summer. Hog prices went merrily along for the ride – much to the benefit of producers.
This fall’s slide in the cutout value indicates that the stellar wholesale level demand of 2020 and the first three quarters of 2021 has declined. Figure 3 reflects actual USDA cutout values for January through November and my forecast for December in the data point labelled 2021. In essence, this scatter chart shows the intersections of supply and demand relationships for each year since 2002. Notice how groups of years lie generally along downward sloping lines, one representing 2002 through 2013 and another representing 2014 through 2020. These lines represent wholesale pork demand (quantities taken at alternative prices) in these time periods. The only exception is 2004 which lies above the first period line and represents the year of the Adkins diet and it’s positive impact on protein demand.
It is clear that, given per capita availability/consumption of roughly 50.5 pounds, prices this year have been far above the level commensurate with 2014-2020 wholesale pork demand. Will this strength last and shift us to another new demand paradigm? At present, it doesn’t appear that the entire gain will be lasting.
The price forecast model feeding into the 2021 and 2022 observations of Figure 3 allows adjustments to reflect current demand conditions. Those adjustments were positive numbers from mid-2020 through August 2021 but have gotten progressively smaller as Q4 has progressed. The 2022 data point shown in Figure 3 involves no adjustment given recent wholesale prices and note that it is back near the 2014-2020 line.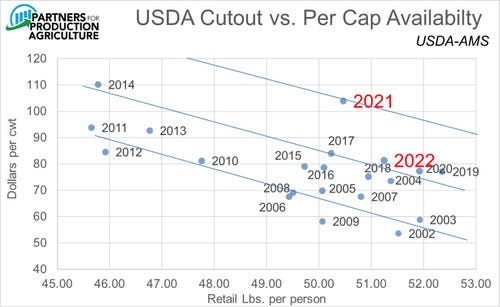
So will demand return to pre-2021 levels or bounce upward once again? That’s a good question at present. If the strength of 2021 is based on changes in consumer behavior, it may very well have some staying power and rebound back toward the 2021 observation, especially with beef and chicken prices strong. One the other hand, rising inflation rates (6.8% for the past year!) suggest that the amount of discretionary income available to consumers may be decreased, possibly putting some negative pressure on meat (and pork) demand. I would love to provide a prediction but I have never been able to predict pork demand levels with any degree of certainty. 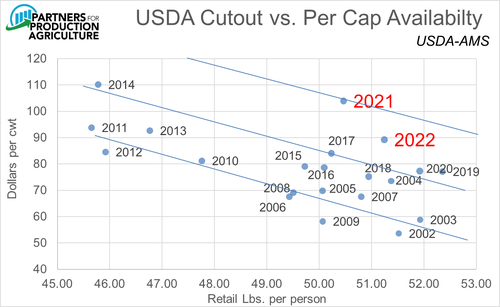
USDA’s December Hogs and Pigs report will be released on December 23 and will garner its usual high level of attention. I expect the December 1 breeding herd, Sep-Nov farrowings and Sep-Nov pig crop to all be very close to last year’s levels. Pre-report surveys of analysts will be published mid-week ahead of the report. The National Pork Board will host its usually webinar for producers and other observers at 3:30 p.m. Central time on December 23. Go to www.porkcheckoff.org for more details.
About the Author(s)
You May Also Like


