Making sure the right hogs get on the truck can pay big dividends.
May 27, 2020

The objective of this article is to identify a profit opportunity in most hog operations. Lock in your added profit by being sure that you are putting the right pig on the truck.
Where the real money is
How often does the barn manager check the feeders? Once a week? Once a month? Hope not!
How often does the marketing team (truck scheduler, marker, sorters) check what is loaded on the truck? Every killsheet? Hope so!
Every load of market pigs represents about 50 tons of feed. When the marketing team says they don't have time to review every killsheet, ask if that excuse would work for not checking the feeders.
The killsheet: Not enough information; we need profit information
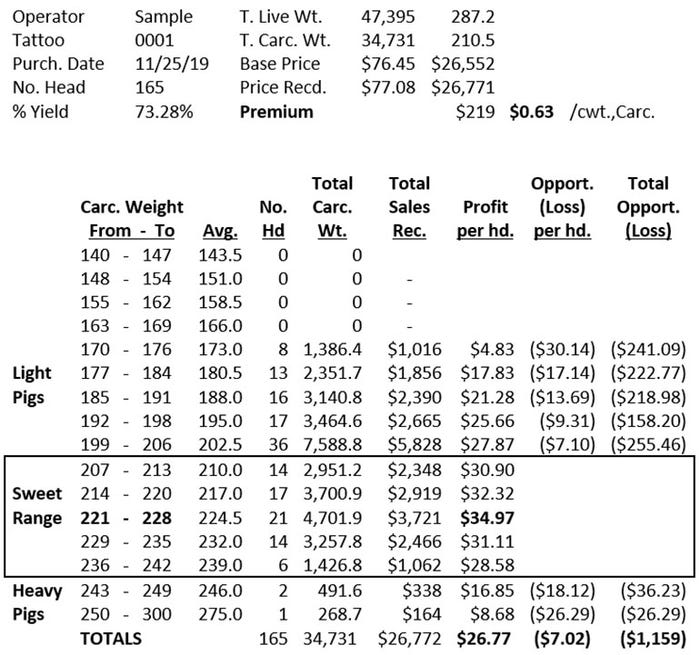
A packer's killsheet reports the number of head, the weight, price, price premiums/discounts and sales revenue, generally by weight category, but nothing about cost or profit. The packer does not know the producer's cost. We can pull cost of production data from the producer's pig group closeout reports to generate Table 1, a modified killsheet.

Opportunity loss
Note that profit per head increases from the lightest carcass on Table 1 up to maximum profit of $34.97 at the 221 to 228 pound range. From there it decreases as weights get heavier. Next note that profit per head at the 170 to 176 pound range is $30.14 less than maximum profit. This $30.14 per head or total $241.09 of opportunity loss was "left on the table" because these eight pigs were put on the truck about 68 pounds per head (live weight) too light. The same kind of calculation holds for the three head of "heavy" pigs.
The killsheet of Table 1 displays 16 weight categories divided into three sections and the opportunity losses accumulated by pigs that are too light and too heavy. (Live weights in parenthesis.)
A 66-pound (88-pound) range of pig weights that are "too light,"
A 58-pound (77-pound) range of pig weights that are "too heavy" and
A 36-pound (48-pound) sweet range of pig weights that provides a reasonable target range to maximize profitability.
Just found $2.75 per head of profit
The opportunity losses of the "light" pigs and the "heavy" pigs total $1,159. This averages -$7.02 per head for the 165-head load. Remember, there is nothing about profit on the packer's killsheet.
The right tool, the Right Pig on the Truck Report, of most producers shows an average opportunity loss per head from $4 to $7, and losses as high as $10 are not unusual. The good news is, these numbers can be brought down to losses of $2.50 to $3 per head, yielding an increase in profitability of $1.25 to $4.25 per head.
That means recapturing $200 to $700 per load. That's a lot of feeder adjustment. This tool distills and analyzes killsheet and other data. The report shown on Table 1 is like your speedometer, you glance at it, make your adjustment and avoid penalties. It saves time, it's enjoyable to use and it's available today.
Practical RPOT experience
Three southern Minnesota producers have experience with putting the RPOT analysis to work in their operations. Pat Duncanson, Shawn Heins and Joel Brandts each fill multiple roles covering ownership, management, load scheduling, marking and sorting.
When asked about the impact of the RPOT analysis on their operations, all three credit the analysis with clearing up the marketing objective(s) replacing "average load weight," "ideal weight per head" and "packer's weight window" with a defined range of carcass weights to maximize profit.
Guesswork and finger-pointing are gone. Now every effort is made to get the biggest pigs on the truck. The cost of missing the target range, as much as $30 to $40 per head, on both the topside and bottom side, encourages that effort.
The three producers say it takes from 24 hours to a couple weeks to see the impact once they have started to use the analysis on their operations. Each producer appreciates the practicality of using the analysis, most of that appreciation coming with the cost of implementation ranging from "Cost is low," "Next to nothing," "No high barrier to entry" and "easy to implement."
In addition to the low cost to implement, the producers see big dividends ranging from $3 per head added profit to "huge."
The analysis led Brandts to increase market weight by 15 to 20 pounds per head, as clear profit measures replaced emotion.
Heins stresses flexibility within the operation, facilitated by adequate finishing capacity and a good relationship with the buyer, required to use information coming from the analysis.
Duncanson finds the key is the distribution of weights around that profit maximizing carcass weight range. He also notes the RPOT Analysis is not for everyone; sufficient scale is needed for marketing flexibility and ownership and management must be willing to learn and make changes.
If throughput (number of head) is the goal of the operation, this analysis and report are probably not for you. If profit is your goal, Duncanson recommends the RPOT Analysis.
For more information, contact Robert Aukes, 515-255-3404, or Mark Storlie, 515-708-7675.
Sources: Robert Aukes and Mark Storlie who are solely responsible for the information provided, and wholly own the information. Informa Business Media and all its subsidiaries are not responsible for any of the content contained in this information asset.
You May Also Like


