July 14, 2014

The United States Department of Agriculture’s (USDA) monthly World Supply and Demand Estimates (WASDE) Report, released on Friday, contained little new information about this year’s crop, but did hold a couple of surprises regarding 2013-14 usage that will impact corn and soybean prices in the coming year. Supply and demand tables for both crops appear below.
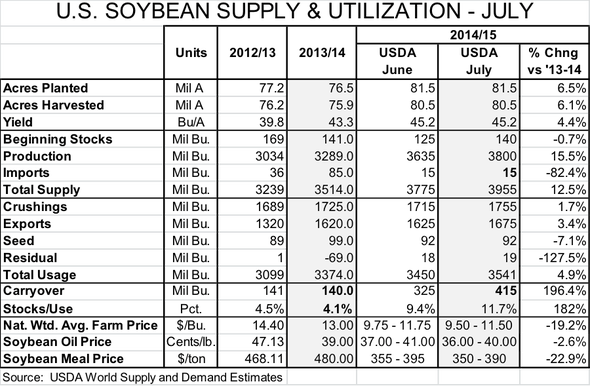
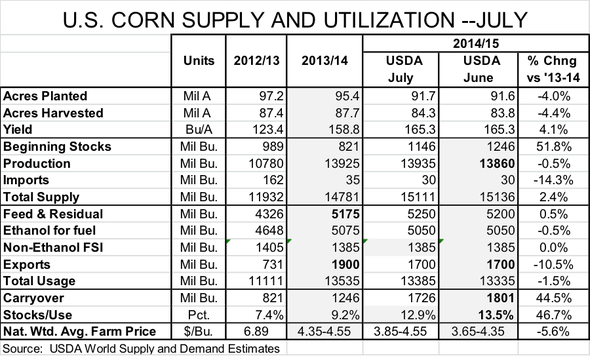
Most noteworthy in Friday’s report is the USDA’s sticking with the trend yield levels it had used in June. That didn’t surprise me at all. Weather so far has been good enough that the USDA did not see any need to reduce projected yields as it did in June 2012, when it was plain that drought and heat would have an impact. But good weather so far guarantees nothing for critical pollination periods when high temperatures or dry conditions could still impact yields negatively. The USDA will have objective (i.e. directly measured) data in August when it will take its first real shot at estimating 2014 yields.
The USDA increased this year’s projected carryout stocks for both products. The increase for soybeans was due to the insertion of a negative residual figure of 69 million bushels, which is basically an upward adjustment of last year’s average yield. The change resulted in a stock increase of only 15 million bushels, but that’s significant when the prior forecast was just 125 million bushels.
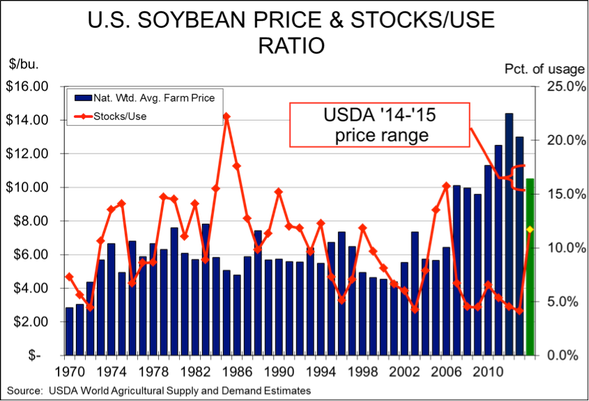
The stock increase, along with record-high soybean acres, is forecast at present to push 2015 year-end stocks to 415 million bushels, a figure quite close to the average pre-report estimate of 418 million bushels. That level of stocks would push the year-end stocks-to-use ratio to 11.7%, its highest level since 2005-06. Soybean meal is still expected to carry the lion’s share of the soybean value but the USDA’s forecast price has now fallen to $350 to $390 per ton, about one-third lower than this past year.
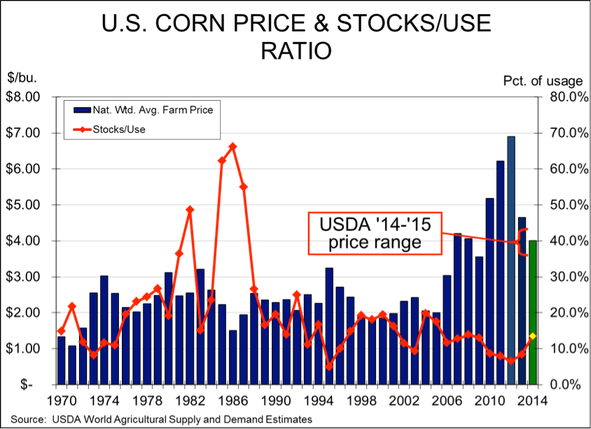
The increase in 2014 corn stocks was due primarily to a reduction in 2013-14 feed/residual usage. Their 5.175 billion bushels is still nearly 20% larger than one year ago, but we suppose the reduction scores some points as a recognition that there just may be a few fewer hogs on feed. The USDA’s projected national weighted average farm price (computed by weighting monthly corn prices by monthly farm sales of corn) is not $3.65 to $4.35. The mid-point is $4.00 and I think it is likely, assuming normal weather from here on out, that harvest lows will be below $4 in many areas and may be as low as $3.50 in Iowa.
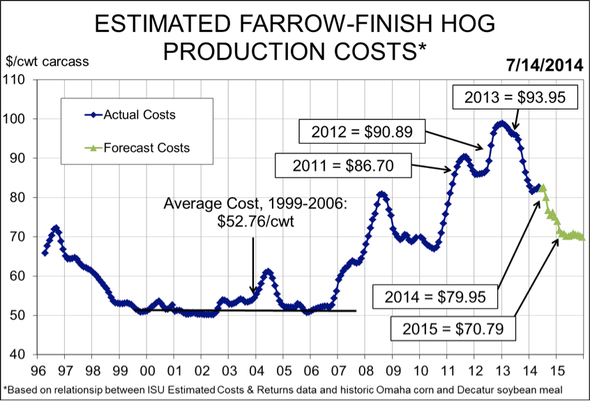
Friday’s WASDE pushed both corn and soybean meal prices sharply lower. That, of course, pushed our estimates of hog costs downward and hog profits upward. Charts of both appear as Figures 3 and 4. Lower new-crop prices have pushed our estimate of average 2014 costs below $80 with fourth quarter costs averaging just over $75/cwt. carcass. 2015 costs are now forecast near $70/cwt. carcass, the lowest level since 2010’s $69.44. Costs below that level are clearly a possibility.
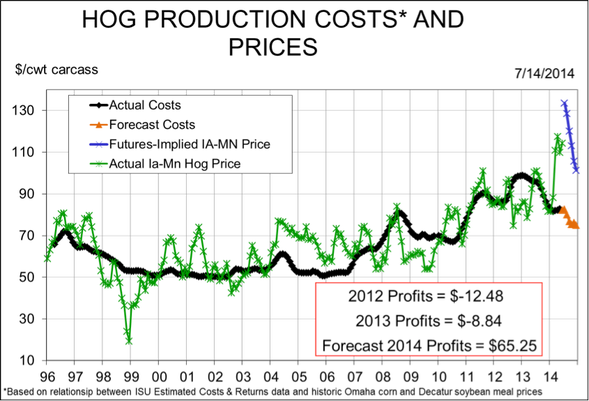
And as for profits – they have never been better. Sales of pigs in March set a record for profits at $81.49 per head for the Iowa farrow-to-finish operations modeled by Iowa State University. My model says that record will fall this month with profits likely over $100 per head!
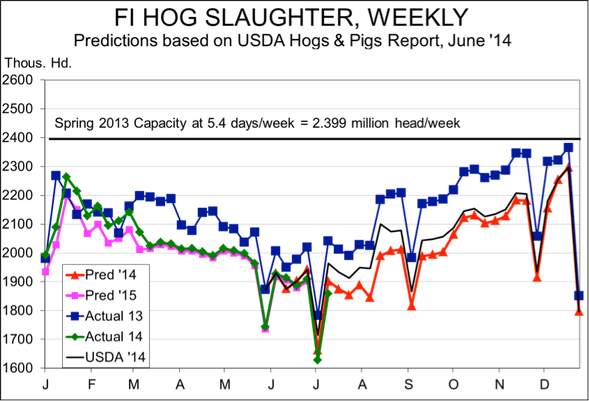
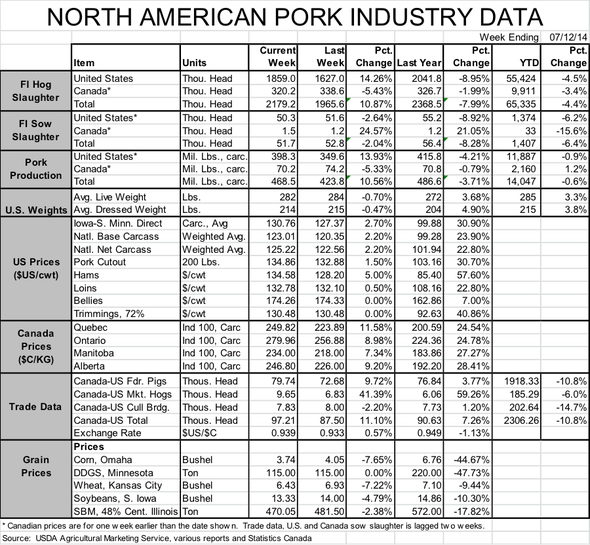
The final piece of noteworthy news this week is that slaughter last week fell almost 9% short of year-ago levels (See Figure 5). That is even more than the week before. More important, last week had no structural excuses (i.e. July 4 falling on a Friday and influencing Saturday kill on July 5) for being lower than last year – and actually may have been a bit high relative to hog supplies because of hogs not slaughtered on July 5. I have been saying all along that the big pig shortage was coming in July, August and September. This may be the first of that wave as the USDA’s estimates for average weights dropped by one pound last week as well. That’s certainly not a big decline but FAR FEWER hogs and LIGHTER hogs both suggest that packers had to scramble for supplies. Look for similar – and even larger – year-on-year slaughter declines this week and for the foreseeable future.
About the Author(s)
You May Also Like


