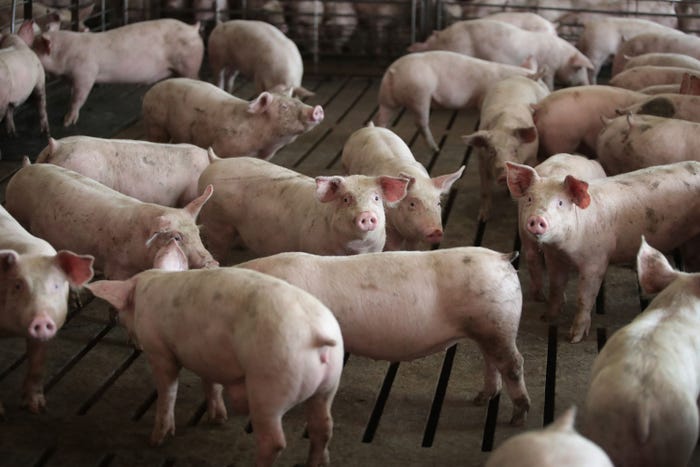
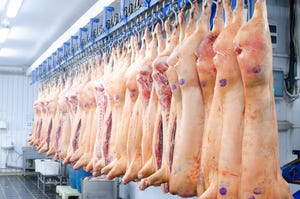
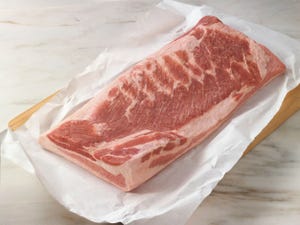
National Hog Farmer is part of the Informa Markets Division of Informa PLC

This site is operated by a business or businesses owned by Informa PLC and all copyright resides with them. Informa PLC's registered office is 5 Howick Place, London SW1P 1WG. Registered in England and Wales. Number 8860726.

It's Time to Pony Up

How many times have you heard someone make that statement or fuss and fret when a raise comes in under the rate of inflation, knowing full well they are losing ground? The most popular measure used to benchmark these gains and losses is the Consumer Price Index CPI for short. CPI is a measure of the average change in prices over time in a market basket of goods and services, explains the Federal Reserve

How many times have you heard someone make that statement or fuss and fret when a raise comes in under the rate of inflation, knowing full well they are losing ground?

The most popular measure used to benchmark these gains and losses is the Consumer Price Index — CPI for short.

“CPI is a measure of the average change in prices over time in a market basket of goods and services,” explains the Federal Reserve Bank of Minneapolis' web site, www.minneapolisfed.org/Research/data/us/calc/index.cfm#calc. It's there that I found a handy CPI calculator where you can simply plug in any year, the price you paid for goods or services that year, then enter the year you'd like to compare the value of a dollar to, click the “calculate” button and in a blink it presents you with the comparative worth.

Here's an example. Your parents have told you they could see a movie for just a quarter in 1950. Using the CPI calculator, plug in 1950, 25¢, 2005, and presto, the calculator reveals the comparative value of 25¢ in 1950 is $2.02 in 2005 dollars.

Impact on Checkoff

Intrigued, I decided to compare the purchasing power of your checkoff dollars over the years.

A call to ag economist Ron Plain at the University of Missouri provided the yearly average price of hogs from 1986 through 2005 (see Table1). The Pork Promotion, Research and Education Act, a.k.a. the “Pork Act,” went into effect in 1986, so we now have 20 years of the mandatory checkoff under our belts. Although the initial checkoff rate was 25¢/$100, I wanted to compare constant dollar values, so I used the current rate of 40¢/$100 to calculate a checkoff contribution on the average value of a market hog in the respective years.

Using the CPI calculator, I then converted those per-head checkoff investments into 2005 dollars. The clinker is, the 51¢/hog checkoff rate in 1986 would be 91¢ in 2005 dollars. In other words, your “real” checkoff contribution has been shaved nearly in half by 20 years of inflation.

I raise this issue because there seems to be an arbitrary ceiling (45 cents/$100 value) on what pork producers are willing to contribute to industry programs. Although the Pork Act set a limit at 50¢/$100 of market value, nowhere is it written that additional funds cannot be voluntarily contributed to pork industry organizations — the National Pork Board and National Pork Producers Council — or even a new industry organization.

As the CPI calculator so vividly shows, your checkoff dollars do not buy as much as they once did. If you felt you got your dollars' worth in 1986, your per-head contribution in 2006 should nearly double — just to stay even.

Now's the Time

With more months of profitability than many of us hoped for, now is the time to rethink priorities and contribution levels.

The challenges are as great, or greater than those we faced two decades ago. Whether it's porcine reproductive and respiratory syndrome or an animal welfare bill banning gestation stalls, your dollars are critical. In 2005, a buck a head was comparable to 56 cents in 1986. It's time to pony up.

Table 1. 20-Year Average Barrow and Gilt Prices
Year $/cwt $/head $/head checkoff (40 cents/$100) Checkoff Value in 2005 dollars ($)
1986 53.63 128.16 0.51 0.91
1987 54.79 132.05 0.53 0.91
1988 45.85 110.94 0.44 0.72
1989 46.40 111.81 0.45 0.71
1990 57.82 140.51 0.56 0.83
1991 51.37 125.85 0.50 0.71
1992 44.64 109.36 0.44 0.61
1993 48.04 118.66 0.48 0.65
1994 41.90 104.34 0.42 0.55
1995 44.06 109.72 0.44 0.56
1996 56.54 140.78 0.56 0.69
1997 54.30 137.92 0.55 0.67
1998 34.72 88.54 0.35 0.42
1999 34.00 87.38 0.35 0.41
2000 44.70 115.77 0.46 0.52
2001 45.81 119.11 0.48 0.53
2002 34.95 91.22 0.37 0.40
2003 39.45 103.36 0.41 0.43
2004 52.51 138.63 0.56 0.58
2005 50.02 132.55 0.53 0.53
TAGS: Business