Livestock Management
More Topics
thumbnail
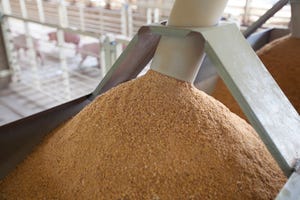
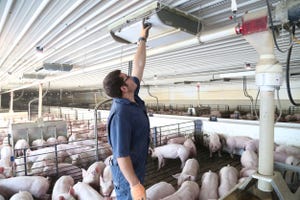
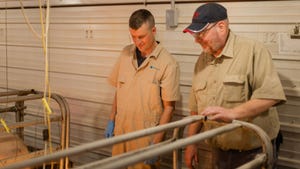
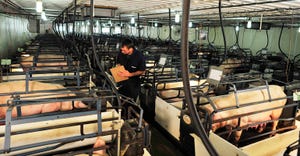
Livestock ManagementLivestock producers find partner in ISU Veterinary Diagnostic LaboratoryLivestock producers find partner in ISU Veterinary Diagnostic Laboratory
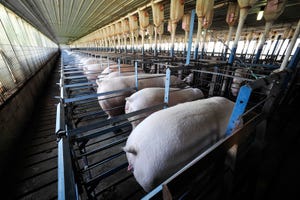
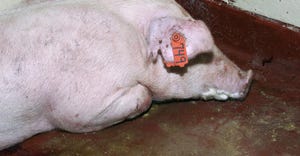
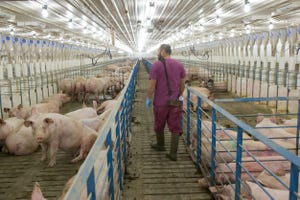
More than 90% of the lab’s cases come from animals being raised for food, and about 75% of the overall cases are swine.


.jpg?width=300&auto=webp&quality=80&disable=upscale)


.jpg?width=300&auto=webp&quality=80&disable=upscale)


Recent Headlines


Enter a zip code to see the weather conditions for a different location.

Sep 27, 2023
Sep 27, 2023
Global Hog Industry Virtual Conference
Subscribe to Our Newsletters
National Hog Farmer is the source for hog production, management and market news