Farm Progress America, April 17, 2024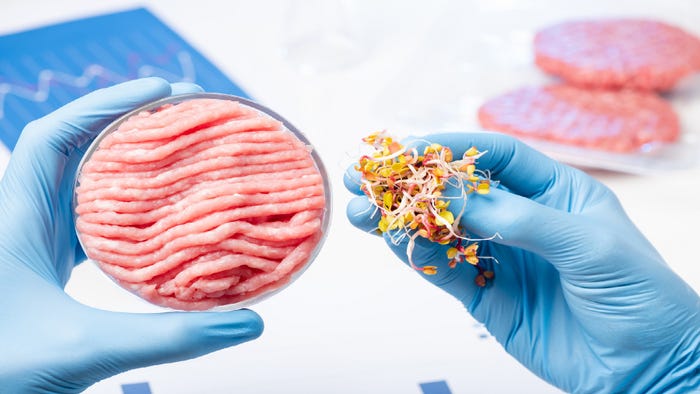
Farming Business ManagementFarm Progress America, April 17, 2024Farm Progress America, April 17, 2024
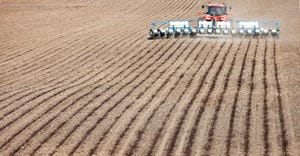
Mike Pearson gives listeners an update on cell cultured chicken in the USA.

.jpg?width=300&auto=webp&quality=80&disable=upscale)


Recent Headlines


Enter a zip code to see the weather conditions for a different location.

Sep 27, 2023
Sep 27, 2023
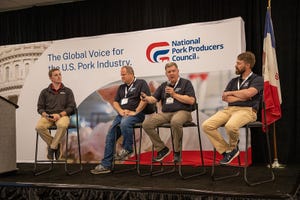
Global Hog Industry Virtual Conference
Subscribe to Our Newsletters
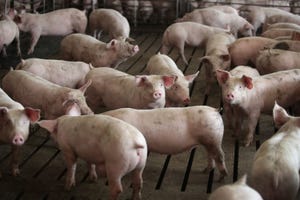
National Hog Farmer is the source for hog production, management and market news