thumbnail
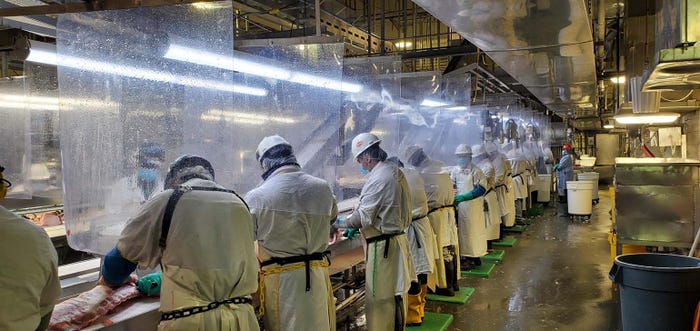
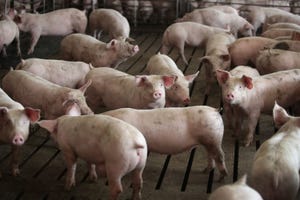
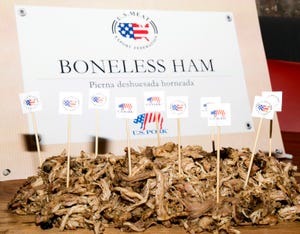
Farming Business ManagementPork producers urge USTR to recommit to aggressive trade agendaPork producers urge USTR to recommit to aggressive trade agenda
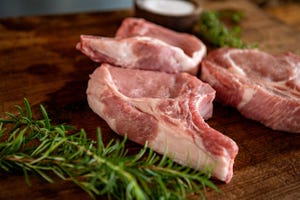
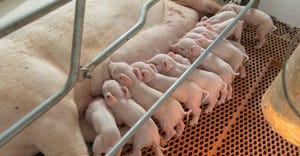
In 2023, exports added the equivalent of $63.76 to the price producers received for each hog marketed, accounted for a record 29.6% of total production.


.jpg?width=300&auto=webp&quality=80&disable=upscale)


Recent Headlines


Enter a zip code to see the weather conditions for a different location.

Sep 27, 2023
Sep 27, 2023
Global Hog Industry Virtual Conference
Subscribe to Our Newsletters
National Hog Farmer is the source for hog production, management and market news