thumbnail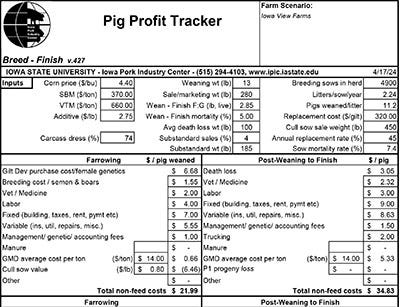
Farming Business ManagementPork production software aids in difficult decision makingPork production software aids in difficult decision making
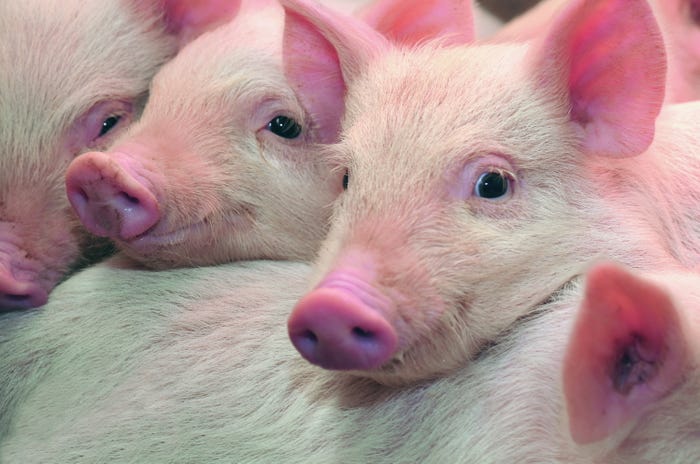
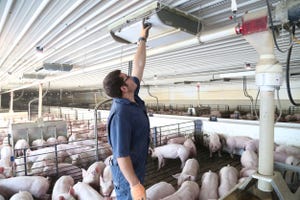
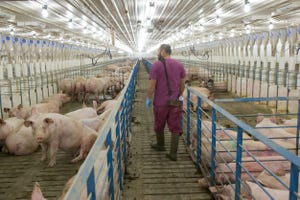
Pig Profit Tracker can help producers assess value, performance changes within their operation.


.jpg?width=300&auto=webp&quality=80&disable=upscale)


Recent Headlines


Enter a zip code to see the weather conditions for a different location.

Sep 27, 2023
Sep 27, 2023
Global Hog Industry Virtual Conference
Subscribe to Our Newsletters
National Hog Farmer is the source for hog production, management and market news