If lactating for 19 days provides the lowest wean-to-service interval for these sows, why lactate beyond that other than the benefit to the pigs?
Last month we looked at the weaning age’s impact on farm performance but based it on the average of the farm. This month we looked at a subset of eight farms and looked at the individual sow’s performance regardless of the farms average. Those eight farms ranged from 26.7 pigs weaned per mated female per year to 29.8 PW/MF/Y over the last 52 weeks.
In Chart 1 the diamonds represent the areas where the farms fall compared to the SMS database for the last 52 weeks. Please note that there may be more than one farm for some of the columns with >=29 pigs weaned with four farms. Those farms have a mated female inventory of 23,000 but we looked at the farrowings over the last three years for each farm for a total of over 170,000 records.

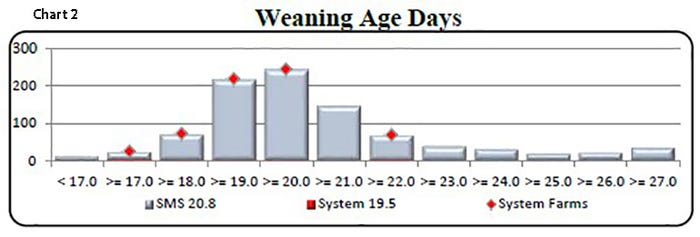
We picked these farms in part to the closeness of performance in PW/MF/YR as well as representing a spread of average wean age from 17.19 to 22.65 days average and where they fall within the database is shown in Chart 2.
As we look at how the previous lactation length (weaning age) impacts wean to service interval Chart 3 shows that before day 12 the numbers keep going up due in part to farms often skipping a heat cycle on those gals to give the uterus time to recover from farrowing. The red line also indicates that there aren’t a lot of girls in that range. Then from day 12 to day 19 wean to service interval goes down with each extra day that she lactates to day 19. Then looking at day 20 to 30 there is an increase in wean to service interval.
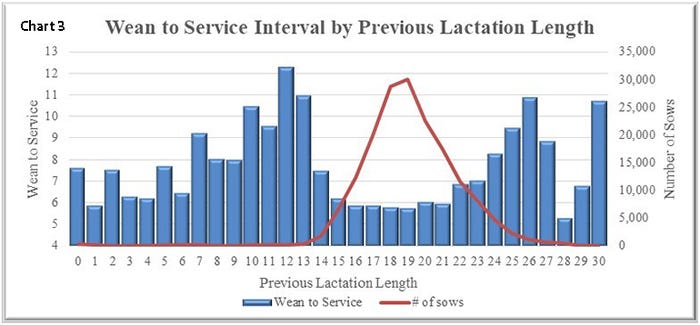
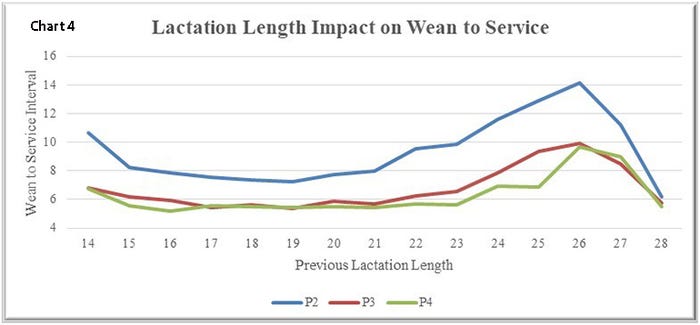
Chart 4 looks at those that are Parity 2, 3 or 4 females. Parity 2 females would represent the lactation length for their gilt litter and wean to service interval following the litter in order to keep the parity information consistent when we look at total born in the next couple of charts. In this dataset when gilts (blue line on graph) lactated longer than 21 days the average wean to service interval jumped up over eight days and peaks at 14 days on day 26. Other parties average about two days less than the P2 line. When looking at P4 (green line) and above wean to service interval stays steady until day 24 before it starts going up.
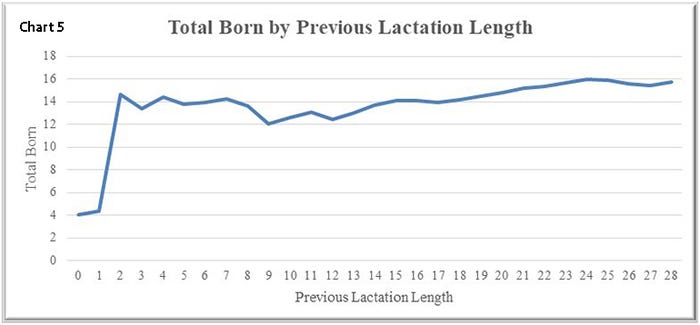
If lactating for 19 days provides the lowest wean to service interval for these sows, why lactate beyond that other than the benefit to the pigs? Chart 5 shows that total born continue to rise each day she lactates all the way to day 25.
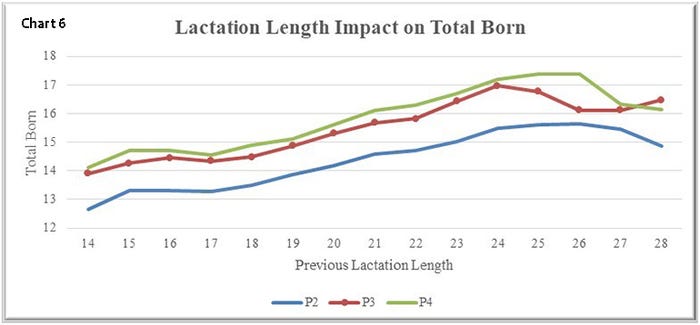
Breaking the performance out by parity in Chart 6 shows that total born goes up consistently to day 25 for all of the parities. Increasing lactation length from day 19 to day 23 adds 1.21 TB while increase wean to service interval by 1.28 days. However, if the farm weans 75% of the increase in total born and the value of a weaned pig is $30 then the farm is still ahead by $24 when you take into account nonproductive day costs at $2.50. Yet, you have to have enough farrowing spaces to do it. Farrowing spaces aren’t cheap so can you accomplish the same thing and reduce sow inventory or make better use of the farrowing spaces you have?
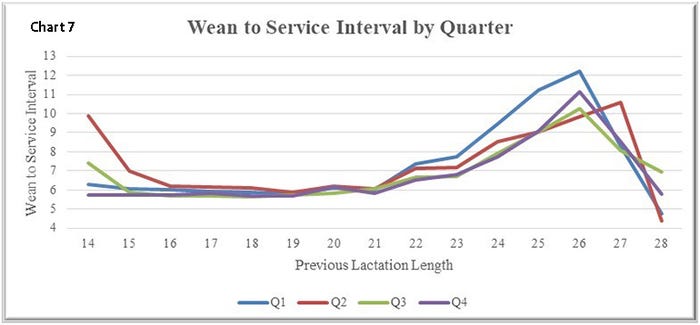
In Chart 7 we looked at the data one extra way by breaking it out by quarter of the year. When we looked at these eight farms it showed very little difference by quarter for wean to service interval. This is not what we would expect to see when looking at a larger set of data and especially if looked at by geographic region.
As you look at your farm’s data and evaluate what is best for your farm consider the following:
How do you minimize the variation in wean age each week to utilize the existing spaces?
What is the cost to move litters to tighten rooms compared to maximizing the performance of your farm?
If you are weaning multiple times per week your variation should be less than seven days.
How quickly can your turnaround the rooms and have them loaded again?
When do you need to load rooms?
If your average gestation length is 116 days do you need to be loading on day 110?
Where is your farm at on the use of inducing?
What is the benefit to weaning an older pig at your farm?
As weaning age goes up the farm will see turns of the farrowing crates go down. What does that cost you?
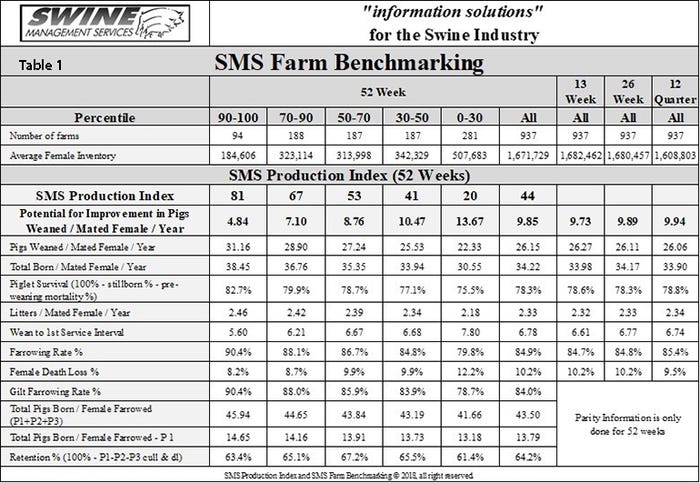
Table 1 provides the 52-week rolling averages for 11 production numbers represented in the SMS Production Index. The numbers are separated by 90-100%, the 70-90%, the 50-70%, the 30-50% and the 0-30% groups. We also included the 13-week, 26 week and 12 quarter averages. These numbers represent what we feel are the key production numbers to look at to evaluate the farm’s performance.
At SMS, our mission statement is to provide “Information solutions for the swine industry.” We feel with the creation of different SMS Benchmarking databases for all production areas we now have more detailed information to share with the swine industry. If your farm would like to be part of the SMS Benchmarking databases, or if you have a specific performance measurement that you would like us to write about, contact Mark Rix, Ron Ketchem or Valerie Duttlinger.
We enjoy being a part of the National Hog Farmer team. Previous columns can be found at NationalHogFarmer.com.
Source: Swine Management Services, which is solely responsible for the information provided, and wholly owns the information. Informa Business Media and all its subsidiaries are not responsible for any of the content contained in this information asset.
About the Author(s)
You May Also Like
