Looking at farrowing rate percentage for the entire farm and for gilts, litters/mated female/year and retention percentage.
This is the second article in a series that looks into key KPIs (Key Performance Indicators) that we feel should be part of your farm planning and goals. Part 3 will be the last article in the series and will be published on March 3, 2021. I encourage your farm management and staff to review the 11 KPIs we are reviewing and determine which KPIs your group needs to be work on in 2021.
The data for the charts are taken from 572 farm in the SMS data base which have 1,064,703 mated females for the last 52 weeks with production at 23-plus pigs weaned/mated female/year. We removed farms that were start-ups, in the process of repopulation or depopulation and farms that may have had a heath challenge in the last year. The farms represent genetics from most of the major genetic companies.
In this article, we are going to look at farrowing rate percentage for the entire farm and for gilts, litters/mated female/year, and retention percentage.
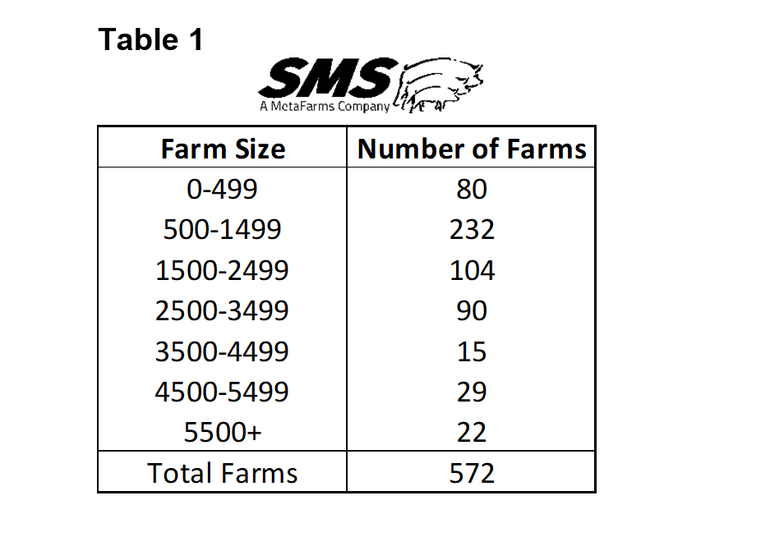
Table 1 shows you the breakout of the 572 farms by size. Fourteen percent of the farms are small at below 500 sows, 232 (40.6%) farms at 500-1,499 sows, 104 (18.2%) farms are at 1,500-2,499 sows, 90 farms (25.7%) at 2,500-3,499 sow, 15 farms (2.6%) at 3,500-4,499 sows, 29 farms (5.0%) at 4,500-5,499 sows and the last 22 farms are at 5,500-plus sows, which is 3.8% of all the 572 farms.
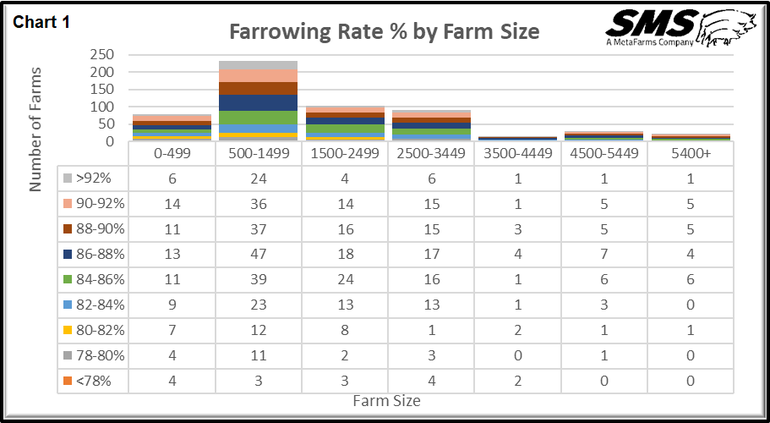
In Chart 1 that explores farrowing rate percentage by farm size, you see there is a large variation in farrowing rate with farms <78% to farms >92% within all farm size groups. The chart shows that regardless of farm size about 20-plus percent of the farms have farrowing rate percentage at 90-plus percent. Most of the farms are in the range of 84-88%. Some people think larger farms have higher farrowing rates, but we see that this is not always the case.
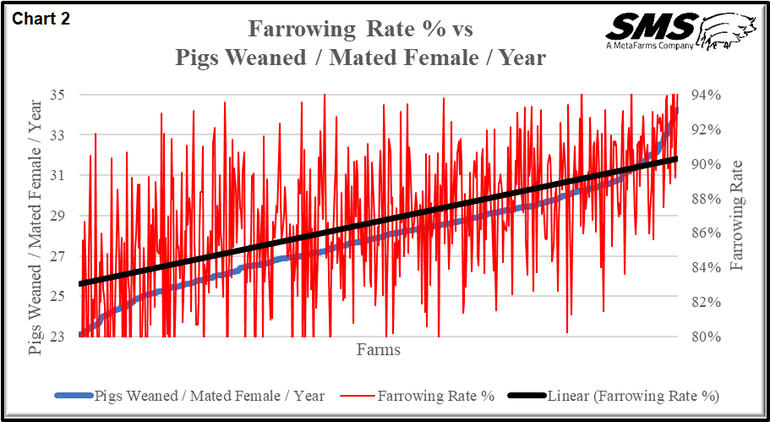
What if you chart the 572 farms by pigs weaned/mated female/year based on farrowing rate? Chart 2 explores farrowing rate percentage versus pigs weaned/mated female/year. The chart is set up with farms on the X-axis, pigs weaned/mated female/year (blue line) on left Y-axis, with range of 23-35 pigs, and farrowing rate percentage (red line) on right Y-axis, with a range of 80-94%. As you can see, there is a lot of variation on farrowing rate by farm, and when you sort the farm by pig weaned/mated female/year, the trend line shows as farrowing rate goes up so does pigs weaned/mated female/year regardless of farm size. Farrowing rate has a large influence on pigs produced.
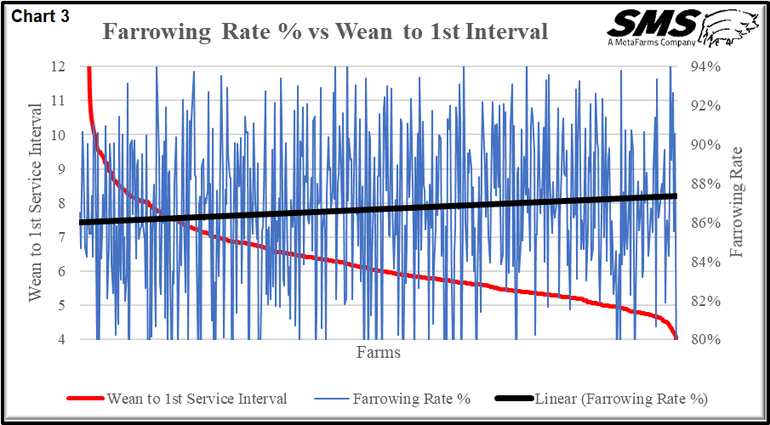
Another influence on farrowing rate is wean-to-first service interval. Chart 3 covers farrowing rate percentage versus wean-to-first service interval. This chart is set up with individual farms on the X-axis, wean-to-first service interval (red line) on the left Y-axis and farrowing rate (blue line) on right Y-axis. As you can see, the wean-to-first service range is from 12 days to four days. You see the linear trend line (black line) farrowing rate moving up as wean-to-first service days drop from 12 to four days. However, you see there is a lot of variation in farrowing rate by farm (blue line). Therefore, a farm needs to work to get more weaned sows bred by day six.
Several years ago, we were looking at farrowing rate and broke it out by parity. Chart 4, which shows gilt farrowing rate percentage versus pigs weaned/mated female/year, is set up with individual farm on the X-axis, with pigs weaned / mated female / year on the left Y-axis (red line) and gilt farrowing rate (blue line) on right Y-axis. This chart shows that as farrowing rate for gilts goes from 70-100%, pigs weaned/mated female/year goes from 23 to 35. This shows that if you want to improve pigs per year, you need to improve farrowing for gilts. In some cases, this may mean changing the breeding procedures and considering breeding gilts first in the morning so the breeders can do a p.m. matings in midafternoon on gilts bred in the a.m. If new gilts are found in heat, they get a p.m. mating followed the next day by an a.m. mating. The key is to lower single matings on gilts.
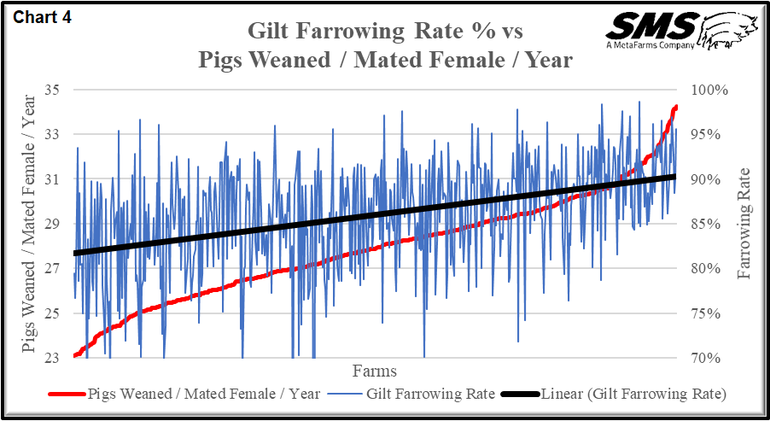
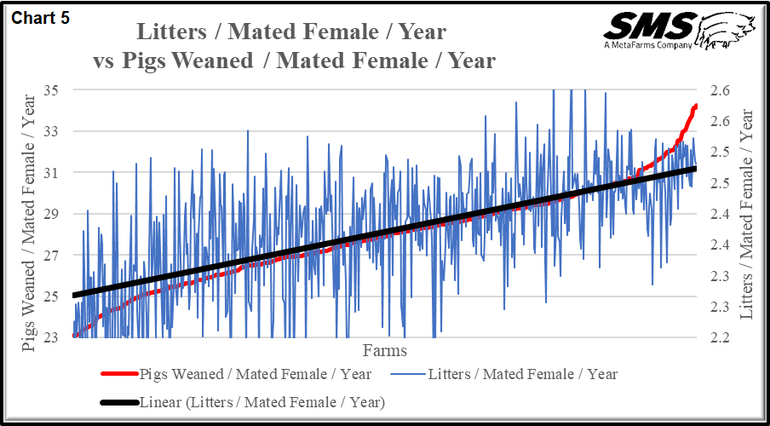
Chart 5 covers litters/mated female/year versus pigs weaned/mated female/year. Like the other charts. this one has farms on the X-axis, pigs weaned/mated female/year on left Y axis (red line) and litters/mated female/year on the right Y-axis (blue line), with a range of 2.2-2.6 litters. The chart shows, looking at the linear black line, that as litters goes up per sow, so does pigs weaned/mated female/year. Improving litters per sow means turning your farrowing crates more times per year. This is influenced by farrowing rate, wean-to-first service interval days, weaning age and open sow days. Over last few years, some farms have moved to weaning older pigs therefore lowering litters/mated female/year. What does that do to cost per pigs?
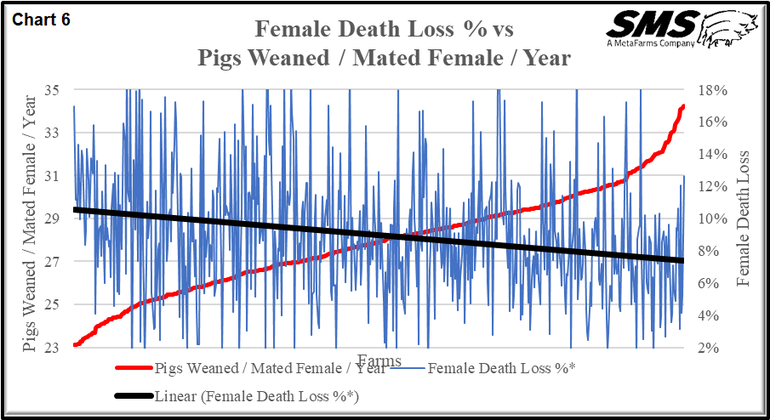
One of the hot topics during the last few years is the yearly increase in female death loss. To look at the influence of female death loss on production we created Chart 6 which explores female death loss percentage versus pigs weaned/mated female/year. Chart is set up with the 572 farms on the x-axis, pigs weaned/mated female/year on the left Y-axis (red line) and female death loss percentage on the right y-axis (blue line). The range in female death loss percentage starting at 2% to 18%. The linear black line shows that as female death loss percentage goes down, pigs weaned/mated female/year goes up. I have a rule of thumb: for each 1% change in female death loss, percentage pigs weaned/mated female/year is changed by 0.25 pigs. So, a 4% change is one more pig/sow/year.
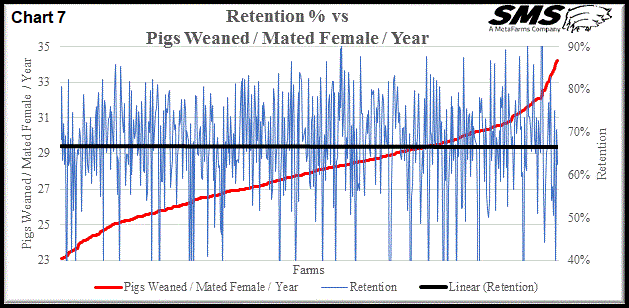
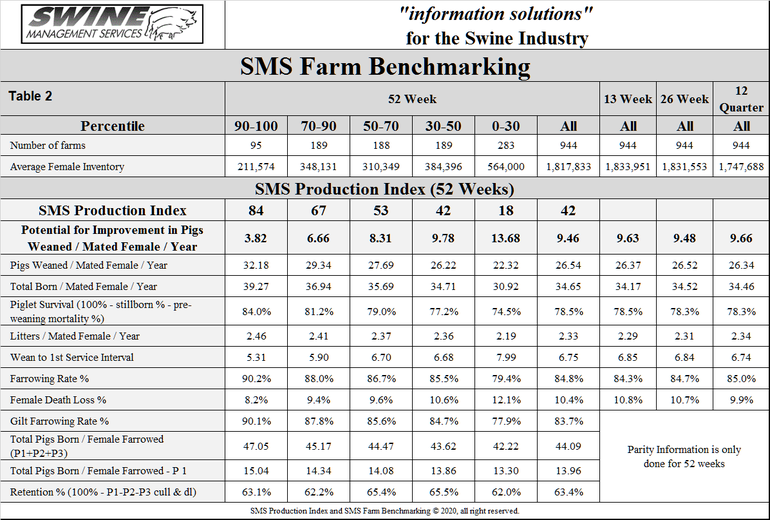
The last KPI we want to cover is in Chart 7, which explores retention percentage versus pigs weaned/mated female/year. Retention percentage was created a few years ago by SMS to attempt to measure how many P1-P3 females are leaving the farm by culling and female deaths. The formula we developed is: Retention percentage= (100% - (P1+P2 + P3 culls & death loss). In Table 2, retention percentage is at 63.3% for all farms in the data set. This chart is set up with farms on the X-axis, pigs weaned/mated female/year on the left Y-axis (red line) and retention percentage on the right Y-axis (blue line). When you look at the linear (retention percentage) black line, it is almost flat, meaning there is some variation in the amount farms, with overall little influence on pigs weaned/mated female/year.
What have we learned is that farrowing rate, especially for gilts, has a large effect on pigs weaned per mated female/year with wean-to-first service having a moderate effect? Litters/mated female/year has a high influence on pigs weaned/mated female/year. Finally, female death loss percentage had moderate influence on pigs weaned/mated female/year, and retention percentage had very little effect.
What KPI(s) does your farm work with? Next month, we will do the final part looking at piglet survival percentage, P1 total born, P1-P3 total born, and SMS production index.
Table 2 provides the 52-week rolling averages for the 11 production numbers represented in the SMS Production Index. The numbers are separated by 90-100%, the 70-90%, the 50-70%, the 30-50% and the 0-30% groups. We also included the 13-week, 26-week, and 12-quarter averages. These numbers represent, what we feel, are the key production numbers to properly evaluate the farm’s performance.
Sources: Ron Ketchem, Mark Rix, and Connor Sharp, with Swine Management Service LLC, are solely responsible for the information provided, and wholly own the information. Informa Business Media and all its subsidiaries are not responsible for any of the content contained in this information asset.
About the Author(s)
You May Also Like

