Tracking various production variables can help farms improve overall success.
To start off 2021, we are going to compose a few articles that look at KPIs (Key Performance Indicators) in more detail. The following 11 KPIs have been used for several years by SMS to calculate our SMS Production Index:
Pigs weaned / mated female / year
Total born / mated female / year
Piglet survival (100% - stillborn percentage- pre-weaning mortality percentage)
Litters / mated female / year
Wean-to-first-service interval days *
Farrowing rate percentage
Female death loss percentage *
Gilt farrowing rate percentage
Total born / female farrowed (P1+P2+P3)
Total born / female farrowed (P1)
Retention (100% - (P1+P2+P3 culls & death loss))
There were 572 farms selected from the SMS data base for the articles. These farms had 1,064,703 mated females with farms at 23+ pigs weaned / mated female with any start up, farms that were depopulating or repopulating taken out.
In Table 1, farms are broken out by size, with 80 farms (14.0%) at 0-499 mated females, 232 farms (40.6%) at 500-1499 mated female, 104 farms (18.2%) at 1500-2499 mated female, 90 farms (15.7) at 2400-3499 mated female, 15 farms (2.6%) at 3500-4499 mated females, 29 farms (5.0%) at 4500-5499 mated females and 22 farms (3.8%) at 5500+ mated females.
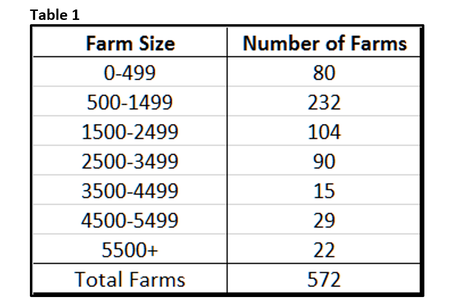
Chart 1: Pigs weaned / mated female / year by farm size- The 570 farms are broken out by farm size on the y-axis and pigs weaned / mated female / year on the x-axis with range of 23 to 34+ pigs. Very interesting to see the large amount of variation in pigs weaned / mated female / year by size of farm, with all farms sizes having farm in 23-31 pigs, all farms except 4500-5499 in the 32 column and seven farms at 34+ pigs, with one being 500-1499 females, one being 4500-5499 and five larger 5500+ farm at the 34+ pigs. Does size of farm matter in producing pigs? Probably not, except for the higher percentage of the 5500+ farm above 31 pigs.
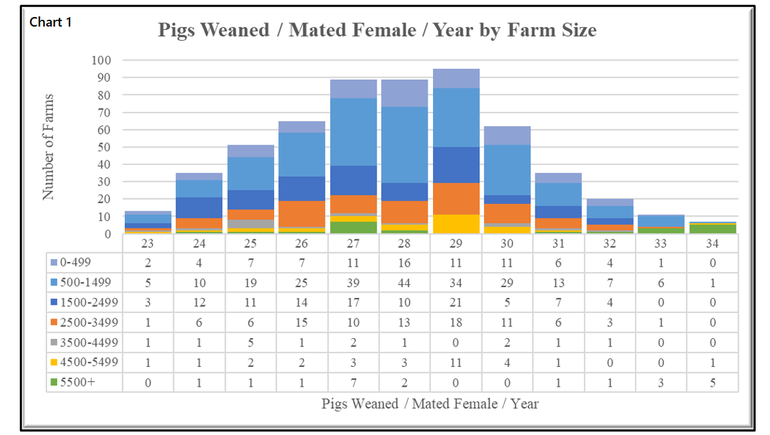
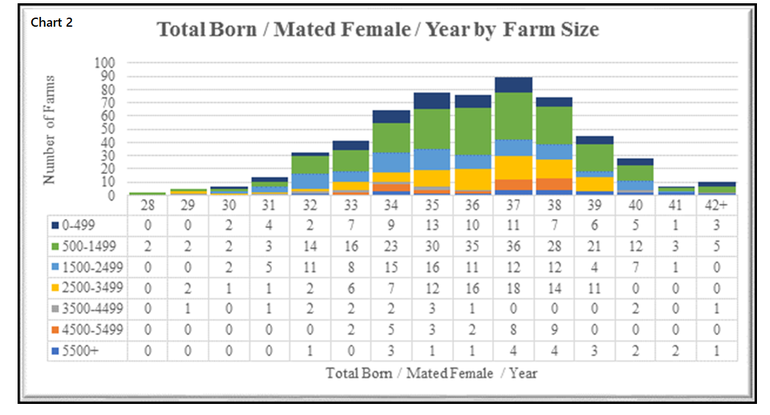
Chart 2: Total born / mated female / year by farm size- The y-axis are sizes of farms and the x-axis showing the potential of total born ranging from 28 to 42+ pigs. The chart shows very few farms, no matter the size, with total born below 31 pigs at only 28 of the 572 farms (4.9%). Note that 45 of the 572 farms (7.9%) had total born at 40+ pigs. There are farms that have the potential of weaning 40+ pigs in the data set.
We continue to hear from farms that have higher total born numbers, saying “just give me 13 total pigs, and I will will be happy.” The data tells a different story.
Chart 3: Pigs weaned / mated female / year versus total born / female farrowed (litter)- On On the left y-axis, the chart has pigs weaned / mated female / year (blue line). Total born / female farrowed on the right y-axis (red line). Total born / female farrowed shows a lot of variation in the 572 farms, going from less than 14.0 pigs and up to 17.0+ pigs. Note the trend line (black) going up as total born / female farrowed increases as pigs weaned / mated female / year also goes up. We agree that farms having the larger litters may have more issue with variation in pig size at birth, more low viable pigs and sometimes more stillborn pigs and mummy pigs. Total born may not be the issue but variation in litter size needs to be addressed to lower that litter-to-litter variation and more changes at the farm to improve day one pig care.
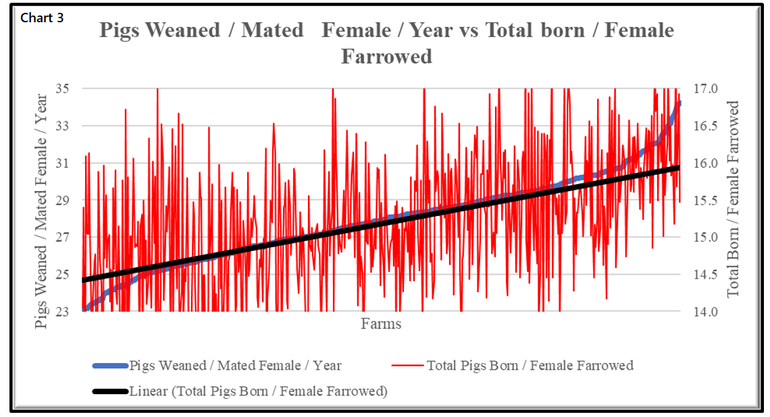
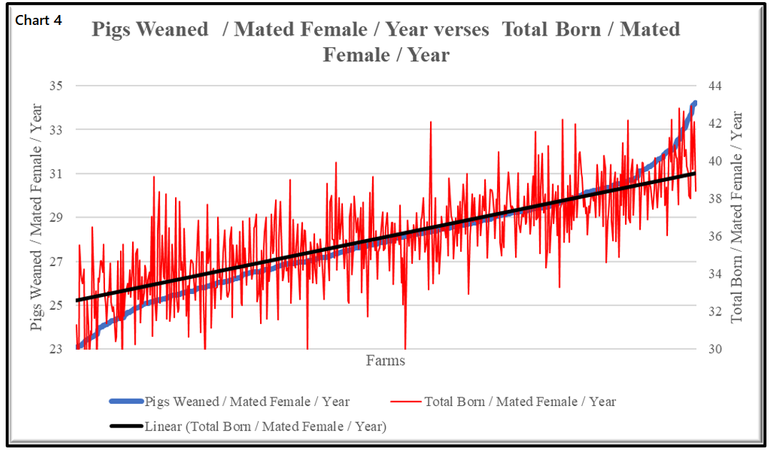
Chart 4: Pigs weaned / mated female / year versus total born / mated female / year- This has the same layout as Chart 3, with the right y-axis being total born / mated female / year (red line). As you see there is a lot of variation, with a a range of less that 30 pigs up to 43+ pigs. The trend line (black line), which goes up for pigs weaned / mated female / year, is influenced by total born / mated female / year.
In summary, if your farm has a low total born of less than 15.0, it will be difficult to get pigs weaned / mated female / year over 27 pigs or total born / mated female / year below 35 pigs.
Wean-to-first-service interval
If your desire is to increase total born, then you need to look at some of the factors that influence that number. To start the discussion about total born, the three charts below look at wean-to-first-service interval.
Chart 5: Wean-to-first-service interval by farm size- Broke out by farm size on x-axis going from 0-499 sows to farms at 5500+ females and left y-axis being number of days to cycle starting at 2.50-3.49 day with 8 catagories up to 9.50+ days. Chart 5 shows 62.2% of the farm has sows cycling in a range of 2 days starting at 4.50 to 6.59 days. Over the last few years, the wean-to-first-service interval average has dropped, with more sow farm getting sows bred in less than 6.5 days. SMS does more detailed farm analysis, which has shown that sows cycle sooner across most genetic lines. What influence does wean-to-first-service have on total pigs weaned / mated female?
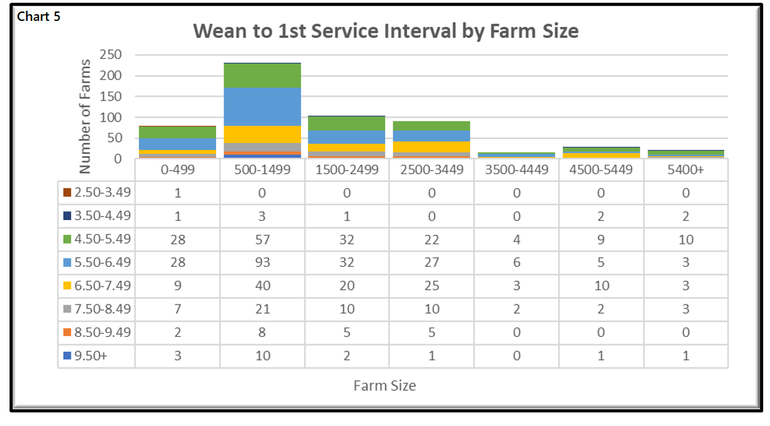
Chart 6: Wean-to-first-service interval verses pigs weaned / mated female / year- This chart is set up with pigs weaned / mated female / year in the left y-axis (blue line) and wean-to-first-service interval (red line) on the right y-axis. As the linear trend line shows, wean-to-first-service interval goes down pigs weaned / mated female /year goes up.
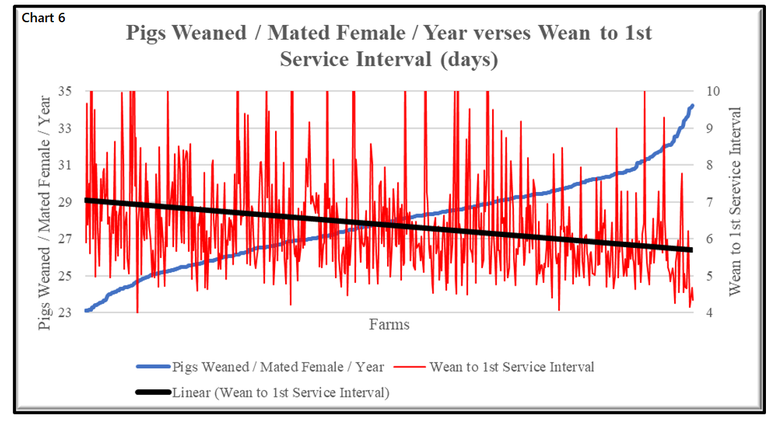
Chart 7: Total born / female farrowed verses wean-to-first-service interval: The left y-axis is wean-to-first-service Interval (red line) and total born / female farrowed (blue line). It shows a lot of variation between farms but that wean-to-first-service interval goes down as total born goes up.
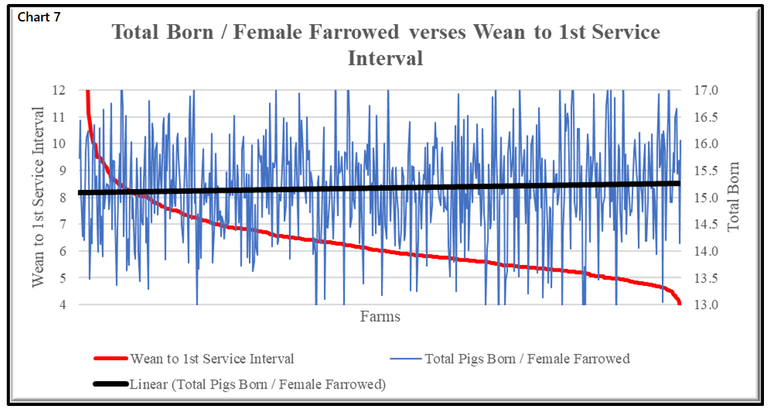
Wean-to-first-service is an influencer and needs attention at many farms. What is your farm doing to lower wean-to-first-service interval? What is your farm doing to get more feed intake in lactation? What is the average intake of sows in lactation per day? How much feed is used from weaning to breeding of weaned sows? What weight do you breed your gilts? These are questions you need to review with farm management in order to formulate solutions for lowering wean-to-first-service interval.
Over the next two months, we will review more of the KPI’s listed above. We hope 2021 will be a better year for your farm and the pork industry.
Sources: Ron Ketchem, Mark Rix, and Connor Sharp, with Swine Management Service LLC, are solely responsible for the information provided, and wholly own the information. Informa Business Media and all its subsidiaries are not responsible for any of the content contained in this information asset.
About the Author(s)
You May Also Like

