While there are many contributing factors to sow mortality like genetics, nutrition, health and the current prolapse issue, the people in the barns are the place to focus first.
You may be sick of hearing about sow death loss and honestly most people are tired of talking about it, but it continues to plague the industry. It not only hurts the performance of the farm, but also the attitude, performance and health of the team members on the farm. In this article we look at 870 farms over a 52-week time period with 1.5 million mated females averaging 26.08 pigs weaned per mated female per year. The average death loss for the time period was at 9% with the removal rate at 45.8%. We did remove some farms that had extenuating circumstances for death loss.
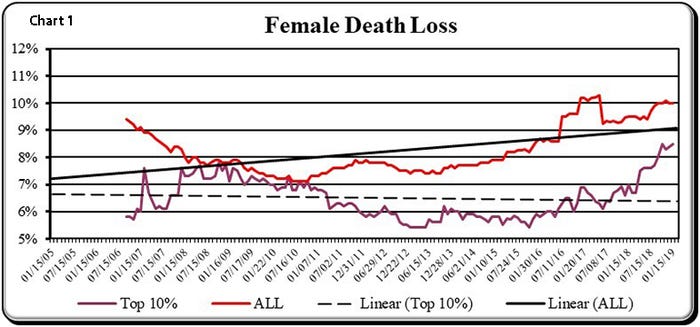
Over the last 12 years the industry has made improvements in sow death loss, but now have lost all of that and more as shown in Chart 1. In 2006 the farms in our database averaged 9.2% while the top 10% (based on PW/MF/Y) of farms were at 5.9%. In 2010, the database reached a low of 7.2% while the top 10% of farms achieved the best in 2012 and again 2014 at 5.9%. In 2019 the database averaged 10% and the top 10% of farms averaged 8.3%.
What has happened over the last several years to drive this increase? A portion of it can be contributed to porcine epidemic diarrhea virus for sure. When farms were being hit with PED virus, gilt supply was impacted and selection rates for replacement females went from high to way too high. Suddenly any gilt that has four legs is entering the herd. This has had lasting impact because that happened at nucleus and multiplication levels as well. If she stayed in the herd for 2.5 years and then her offspring another 2.5 years, you could be looking at that “bad” animal impacting replacement females for 5 years.
As we look at farm size in Chart 2 it shows that the larger the farm the higher the sow death loss.
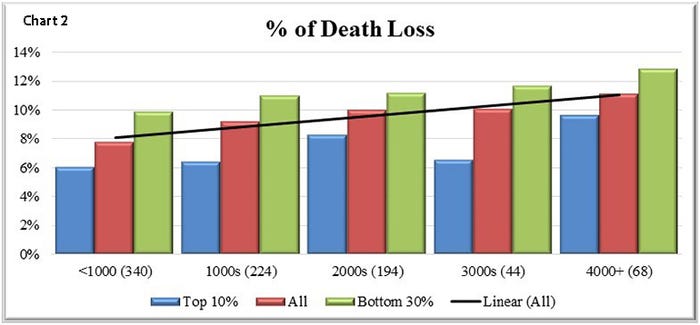
The number in parenthesis indicates how many farms are in that group, so for sow farms with more than 1,000 sows there are 340 farms in that group. The top 10% and bottom 30% of farms is based on PW/MF/Y, not death loss. Farms less than 1,000 sows were at 7.8% sow death loss over the 52-week time period while farms that were over 4,000 sows were at 11.1%.
As we look at the losses by parity in Chart 3 it shows that nearly 50% of the losses are occurring in P0-P2 females. This number is likely over the 50% mark if all farms were consistent in how gilts were entered.
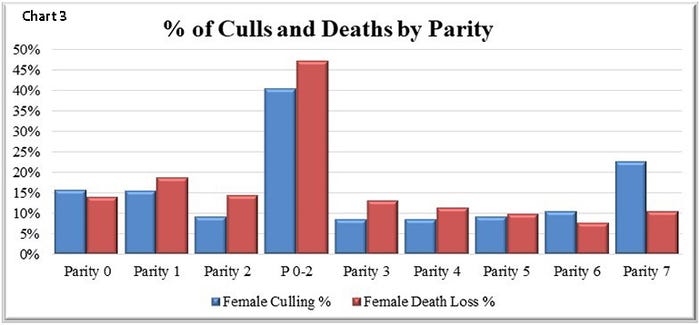
Stalder, et al 2000, have shown that it typically takes a sow to reach parity 3 or 4 in order for you to recover the entry and development costs. The data is indicating that over 50% of the deaths are occurring before that point as well as 40% of the removals.
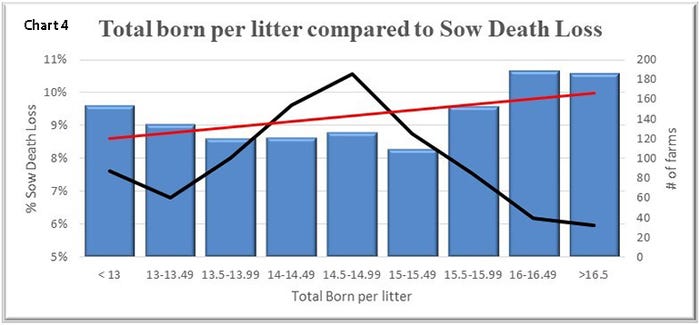
In Chart 4 an interesting trend that looks at total born per litter compared to sow death loss. When total born was broken into ranges, the higher the total born the higher the percent of sow death loss as shown in the blue bars with the red line representing the trend. The black line reflects the number of farms from each group. Farms over 16 total born at 10.25% sow death loss on average.
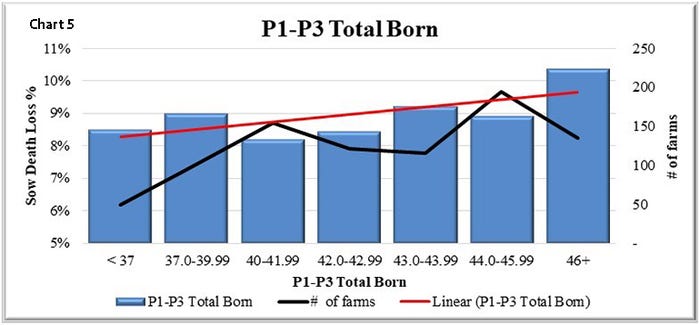
In Chart 5, when looking at the combined total born for P1 to P3 it shows the same trend. The higher the total born in young sows the higher the death loss for the entire farm.
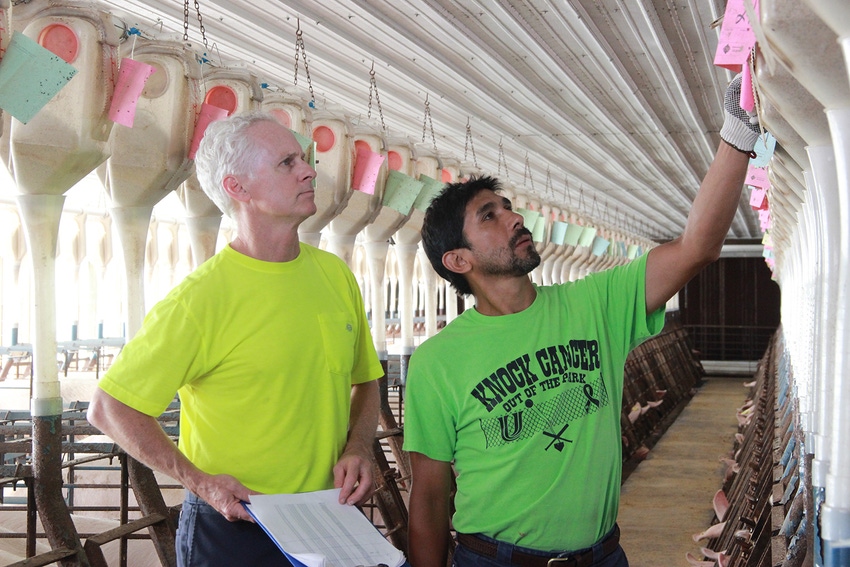
While there are many contributing factors to sow mortality like genetics, nutrition, health and the current prolapse issue, the people in the barns are the place to focus first. Training, training and more training is needed to help combat this. Training does take time, but so does removing dead animals from the farm.
Here are some focus areas to think about:
Train staff not only to detect illness and injury sooner but to treat appropriately. Treating isn’t always medication, sometimes it just means removing them from a pen setting or applying a topical treatment.
Work with your veterinarian on a list of treatment options for different illnesses and injuries and make that available to the barn staff.
Get females up every day. Even if she is eating, she may be developing an illness or injury that hasn’t impacted intake yet.
Feed and care for growing gilts. The future success of the farm depends on them. That means not feeding a finishing or least cost diet, but a diet that will help set them up for success in the future. Provide a good environment for them and allow extra space.
Be more critical of the animals entering the farm. If gilts coming into the farm are not structurally correct the cycle continues. Having higher sow death loss increases the need for more replacement females or at least hanging on to other sows that should be culled creates a never ending cycle. Until a farm creates higher standards for entry into the herd there will continue to be an increase number being lost to lameness and injury.
Trimming toes and dew claws as needed, this can be done without a lift. The declaw injuries are often the most costly in pen settings.
Checking the temperature of sows post farrowing. In this previous article we showed that 30% of the deaths in a subset occurred in the 9 days around farrowing from 115 to 123 days. By checking the temperature of sows, fever and infection can be detected sooner than observing lack of feed and water intake or discharge.
Most importantly is holding team members accountable for these steps, as doing the above will result in improvements. Make sure you show them the impact they are making.
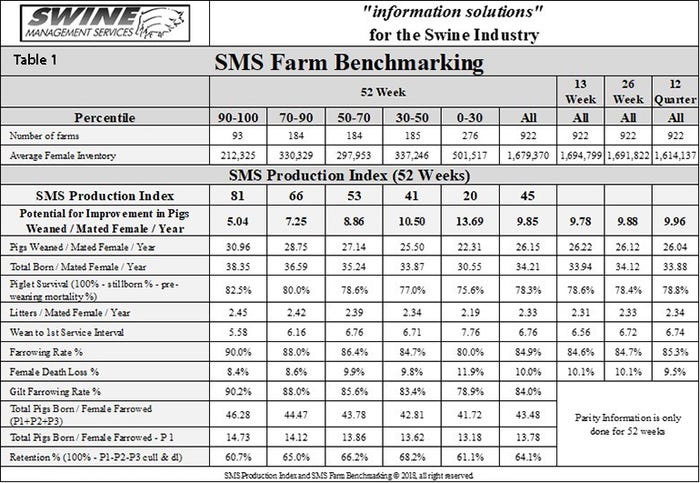
Table 1 provides the 52-week rolling averages for 11 production numbers represented in the SMS Production Index. The numbers are separated by 90-100%, the 70-90%, the 50-70%, the 30-50% and the 0-30% groups. We also included the 13-week, 26-week and 12-quarter averages. These numbers represent what we feel are the key production numbers to look at to evaluate the farm’s performance.
At SMS, our mission statement is to provide “Information solutions for the swine industry.” We feel with the creation of different SMS Benchmarking databases for all production areas we now have more detailed information to share with the swine industry. If your farm would like to be part of the SMS Benchmarking databases, or if you have a specific performance measurement that you would like us to write about, contact Mark Rix, Ron Ketchem or Valerie Duttlinger.
We enjoy being a part of the National Hog Farmer team. Previous columns can be found at NationalHogFarmer.com.
Source: Swine Management Services, which is solely responsible for the information provided, and wholly owns the information. Informa Business Media and all its subsidiaries are not responsible for any of the content contained in this information asset.
About the Author(s)
You May Also Like

