Subscribe to Our Newsletters
National Hog Farmer is the source for hog production, management and market news
November 11, 2013

Since we are writing one to two articles per month, we wanted to update Weekly Preview readers on the changes we are making to our benchmarking database and the numbers we share every month.
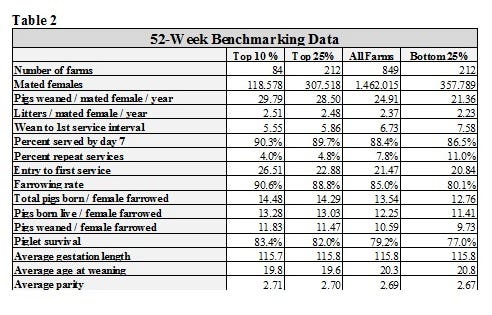
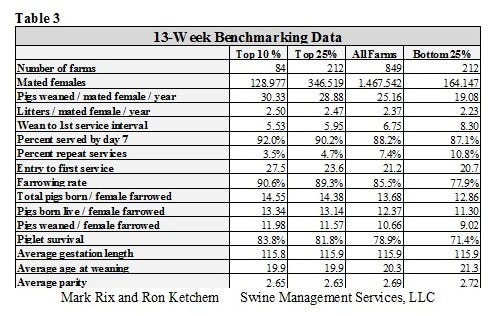
The Key Performance Indicators have been part of every article we have written over the last four years (See Tables 2 and 3). We have used the following Key Indicators calculated by the Top 10%, the Top 25%, "All Farms," and the "Bottom 25%" of the farms in our database:
Number of farms
Mated females
Pigs weaned / mated female / year
Litters / mated female / year
Wean to 1st service interval
Percent served by day 7
Percent repeat services
Entry to first service
Farrowing rate
Total pigs born / female farrowed
Pigs born live / female farrowed
Pigs weaned / female farrowed
Piglet survival
Average gestation length
Average age at weaning
Average parity
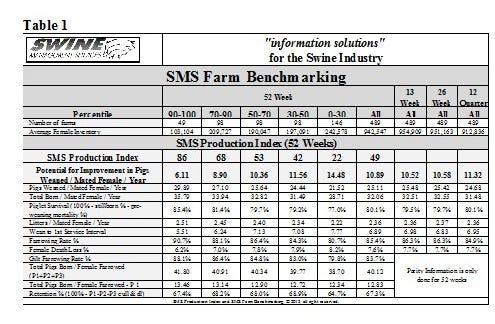
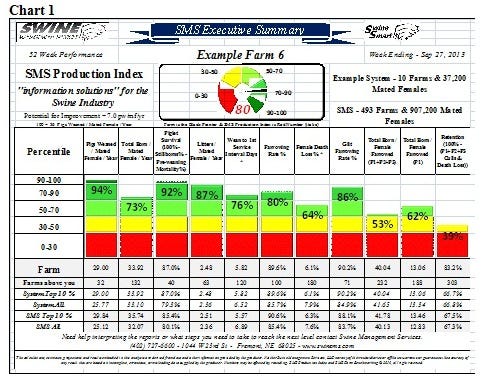
Starting with this article, we will be using the NEW SMS Farm Benchmarking program and SMS Production Index (See Chart 1 and Table 1). Currently, we have 486 farms and 928,000 females in the new database; we will be adding another 100+ farms in November. Our new database will help indicate:
SMS Production Index
Potential for Improvement in Pigs Weaned / Mated Female / Year
Pigs Weaned / Mated Female / Year
Total Born / Mated Female / Year
Piglet Survival (100% - stillborn % - preweaning mortality %)
Litters / Mated Female / Year
Wean to 1st Service Interval
Farrowing Rate %
Female Death Loss %
Gilt Farrowing Rate %
Total Pigs Born / Female Farrowed (P1+P2+P3)
Total Pigs Born / Female Farrowed - P 1
Retention % (100% - P1-P2-P3 cull & death loss)
A major change is how the farms are separated into percentiles. In the old program, the Top 25% included the Top 10% farms. In the new program, we have separated the farms into the Top 90-100%, the 70-90% category, the 50-70% category, the 30-50% category and 0-30% category. As a result, no farm is represented in more than one category.
SMS Production Index is a calculation we created four years ago using eight production numbers. In the new program we have changed the calculation to include 11 production numbers, four of them coming from the new parity benchmarking. If a farm was at 100 on the SMS Production Index it would be achieving 36 pigs weaned / mated female / year. Read the article in the Aug. 5, 2013 issue of Weekly Preview to see how we came up with 36 pigs weaned / mated female / year. The Index is calculated by multiplying the farm’s percentile for each of the 11 production numbers by a factor (a trade secret) and adding them together.
Potential for Improvement in Pigs Weaned / Mated Female / Year is a new calculation. It subtracts the actual pigs weaned / mated female / year from 36. With the current 25.06 pigs weaned / mated female / year, that means the average Potential of Improvement is 10.94 pigs.
Pigs Weaned / Mated Female / Year is pigs weaned in the period divided by the days in the period (the number of days the report is run for) multiplied by 365 days divided by the average mated female inventory in the period.
We have added Total Born / Mated Female / Year to the Index because the articles we have written have shown this to be a key number. Total pigs born / mated female / year represents pigs born in the period, divided by the days in the period (the number of days the report is run for) multiplied by 365 days divided by the average mated female inventory in the period.
Piglet Survival is a term we came up with several years ago to compensate for the different way farms define stillborns and preweaning mortality. It does not matter which bucket the dead pig is carried out in. It is our opinion that most stillborn pigs are potential liveborn pigs if you attend the farrowings. The calculation is 100% - the percent stillborns in the period - the percent preweaning mortality in the period.
Litters / Mated Female / Year is females farrowed in the period divided by the days in the period (the number of days the report is run for) multiplied by 365 days divided by the average mated female inventory in the period.
Wean to first Service Interval is the average of days for weaning to the first mating for all females weaned and served in the period
Farrowing Rate% is a calculation that is not 100% accurate because it uses a standard gestation length to calculate the number of females served to farrow in a period, usually 114 or 115 days. Gestation length actually has a range of 110 days to 122 days, with an average close to 116 days. The longer the period, the more accurate is the calculation.
Female Death Loss% is the number of females that died in a period divided by the days in the period times 365 days divided by the average female inventory. The problem with this calculation is how gilts are entered into the record program, because some farms enter gilts 120+ days before the first breeding and other farms enter gilts at the first breeding.
The next four numbers are new and they come from the new parity benchmarking program. We have written numerous articles on the importance of gilt development and how the performance of gilts will set them up for how they will perform the rest of their life.
Gilt Farrowing Rate% is a key driver in how the farm will perform in the future.
Total Pigs Born / Female Farrowed (P1+P2+P3) is a new calculation we have created. It adds the number of pigs born / female farrowed for parities 1, 2 and 3. We feel is important in measuring gilt development. It looks at how well the gilts performed, plus it looks at measures if there was a parity-2 dip.
Total Pigs Born / Female Farrowed - P1 looks at the performance of gilt litters and is a good indicator of gilt development in addition to being a good indicator of the future performance of the gilt throughout her life.
Retention % (100% - P1-P2-P3 cull & death loss (dl)) is a new calculation we developed to look at how well a farm is developing gilts to get them into the more productive parties of 3-5. It is not a cohort analysis calculation, and is to be used as a comparison between farms. The calculation is 100% minus culls and death loss for parities 1, 2 and 3. We would have loved to include the percent gilt culls and death loss, but with the differences in how gilts are entered into the records programs, it is not a good comparison between farms.
The analysis of data has increased our knowledge level of what really drives production on farms. We have had to change some of our thoughts on how to manage sow farms. The farms that are open minded and willing to step out of the box and try different and new management ideas are learning what it takes to produce more quality weaned pigs per mated female per year. The new numbers we have added are designed to help producers step out of the box to make improvements.
Previous Production Preview columns can be found at www.nationalhogfarmer.com.
SMS Production Index
Table 1 provides the 52-week rolling averages for 11 production numbers represented in the SMS Production Index. The numbers are separated by 90-100%, the 70-90%, the 50-70%, the 30-50% and the 0-30%. We also included the 13-week, 26-week and 12-quarter averages. These numbers represent what we feel are the key production numbers to look at to evaluate the farm’s performance.
If you have questions or comments about these columns, or if you have a specific performance measurement that you would like us to write about, please contact: [email protected]or [email protected].
You May Also Like
Enter a zip code to see the weather conditions for a different location.


