Hog Reproduction
thumbnail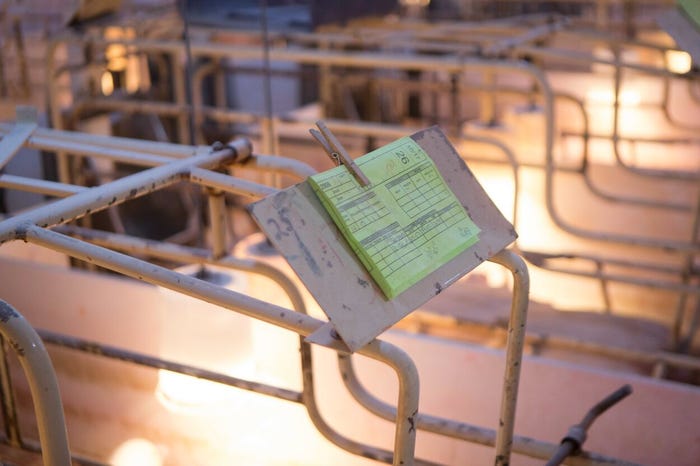
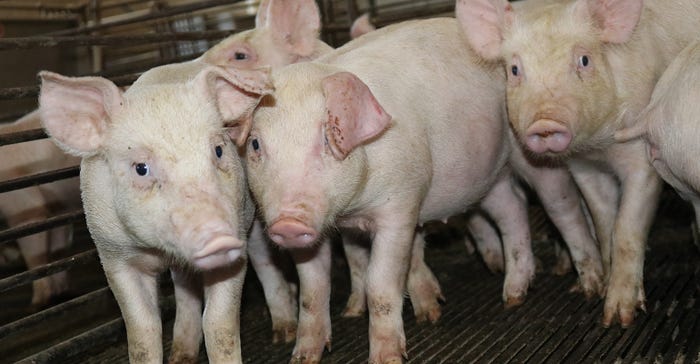
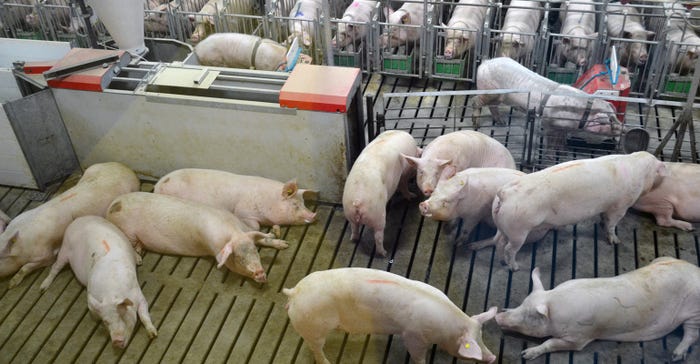
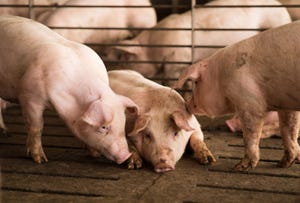
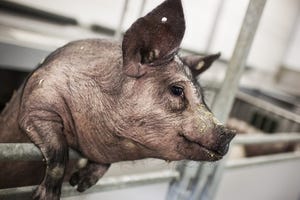
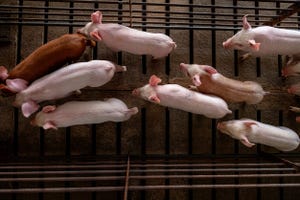
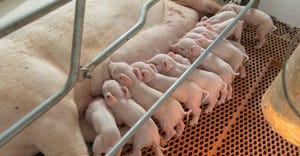
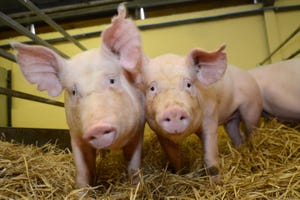
Livestock ManagementMaximizing pork production: Importance of a quality breed targetMaximizing pork production: Importance of a quality breed target
Sow farms that have the best opportunity for consistent farrowing rates, productivity, will drastically minimize any repeat services in their farms.


.jpg?width=300&auto=webp&quality=80&disable=upscale)
.jpg?width=300&auto=webp&quality=80&disable=upscale)


Recent Headlines


Enter a zip code to see the weather conditions for a different location.

Sep 27, 2023
Sep 27, 2023
Global Hog Industry Virtual Conference
Subscribe to Our Newsletters
National Hog Farmer is the source for hog production, management and market news