

Subscribe to Our Newsletters
National Hog Farmer is the source for hog production, management and market news
March 12, 2012

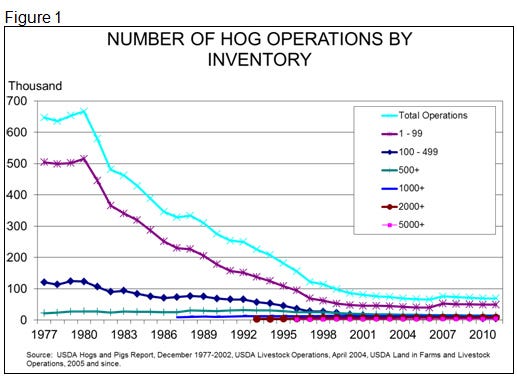
The number of total hog operations held steady at 69,100 in 2011, marking the first year without a decrease since 2007 – the year USDA changed the way it counts farms. That change resulted in the first annual increase in hog operations since 1988. Omitting the 2007 counting change, 2011 is only the second year since 1980 in which total hog operation numbers have not fallen.
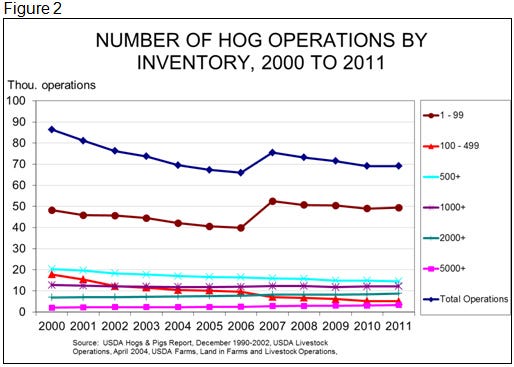
Figure 1 provides a long-term perspective for these numbers. There were over 600,000 hog operations – defined as a farm (i.e. place) on which hogs were kept at some time during the year – in 1980. The sharp reduction in hog operations that followed the 1980-production surge and resulting low prices began nearly 20 years of significant reductions save that one year in 1988. The numbers have stabilized to a great degree since 2000 (Figure 2), but there have been some changes in market shares even during that time.
Why did farm numbers fall so sharply? In a word – technology. New developments in housing, disease prevention and control, feed processing and delivery, information systems and many more aspects of hog production made it possible for one person to raise more and more hogs. What was once a land extensive, high labor sector became management, capital and labor intensive.
I believe the key factor in that change is that it allowed superior (and sometimes visionary) managers to leverage their talents over larger and larger enterprises. What once just required “good hog men” now provided capital that those good hog men could use to become even better hog men and hog women.
Innovation did not stop with technology. New business practices – the most noteworthy being contract production – provided new opportunities to access capital and leverage that capital in a manner that allowed much faster growth than had previously been attainable when working off individual balance sheets. A producer with an advantage in managerial ability could grow and grow quickly. With the cost advantages of size and scale, this provided ample opportunity for a small set of producers to capture market share at a time when many could not afford to retool more traditional production systems.
Figure 2 shows the low-hanging fruit has been picked. The only significant change in the lines in the chart is the downtrend of operations with inventories of 100-499 head. The smallest farms (1-99 head) actually grew in number in 2011, going from 49,000 to 49,400.
The Game-Changers
A “location upon which there were pigs” began to lose its clear meaning with the advent of contract production. One business could own many “operations” in a contract world, so in 1988 USDA began reporting both farm numbers and inventory shares, by size, based on ownership. They also added larger farm size breakdowns to provide more detail on the largest class sizes.
The chart of operation numbers by ownership from 1998 through 2011 looks much, much like Figure 1 over a condensed time frame. It just has more lines jammed into the lower end of the vertical axis since it breaks the 5,000+ category into four separate ranges up to 50,000 and over.
I think what is more interesting is the changes in inventory shares among these different size operations over time (Figure 3). It is clear that the largest operations, those having over 50,000 head and more under single ownership, gained share rapidly through 2004, but then their growth began to slow. It is also clear that operations with 2,000 head and more have basically held their own since USDA began this data series.
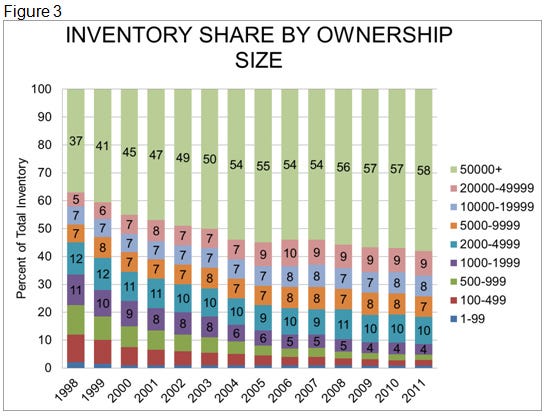
But operations with less than 2,000 head in inventory have lost ground steadily. These operations would market about 4,000 pigs annually or have somewhere around 200 sows. There are few economies of size available to these producers. My impression – and the implication of this chart – is that they do not compete well with larger producers who very likely have lower per-unit costs. Smaller operations, though, almost certainly have an advantage in delivering value-added, niche type products, but they must find consumer and packer buyers who are willing to pay a premium for the characteristics they can deliver.
Will technology come along to even the playing field? Perhaps. Will the technologies that have provided a cost advantage to larger firms be banned and, thus, even the playing field? Some would like that and it may be possible.
But the battle over gestation stalls is informative. Some small-farm advocates believe that banning stalls will handicap large producers and provide more opportunities for small farms. It may do that to a small degree, but the truth is that large operations are large because they are good at what they do. They are good because they are adaptive and creative and they generally have access to enough capital – their own, borrowed or equity – to handle modernizations. Even costly ones.
If stalls become a thing of the past, most large operations will find ways to use electronic sow feeders, free-access stalls, or to manage small or large groups or whatever else comes along. They may have to do things differently, but they will not go away anytime soon.
You May Also Like
Enter a zip code to see the weather conditions for a different location.


