Subscribe to Our Newsletters
National Hog Farmer is the source for hog production, management and market news
September 29, 2014

The U.S. Department of Agriculture’s Hogs and Pigs report, released on Friday, indicates that the U.S. industry has moved quickly to take advantage of record profits and backfill productivity losses caused by porcine epidemic diarrhea virus (PEDV). Every key number in Friday’s report was larger than anticipated by market analysts. The report is bearish and CME Group Lean Hogs futures are lower across the board as of mid-session on Monday.
The USDA’s June report has proven to have been too low on market hog numbers with actual slaughter running about 3.5% lower than the inventories in that report would have indicated. The USDA revised its December-February pig crop downward by 3.6% to reflect this slaughter discrepancy, meaning that the March report indeed underestimated the impact of PEDV during the winter months. Curiously, the USDA reduced December-February farrowings by the same percentage, thus leaving litter size unchanged at 9.53 pigs per litter. Given what we know of PEDV, what do you think it impacted more in the December-February quarter – the number of sows that had litters or the number of pigs saved per litter? We definitely think it was the latter.
This is hardly a distinction without a difference. As 2014 ends and 2015 begins, the key issue is going to be how much pigs saved per litter rebounds from the abysmal PEDV-driven levels of one year ago. We are now into a time period where we will be comparing to PEDV-impacted figures one year ago. Will PEDV have the same impact as last year, thus leaving litters the same as one year ago or will the PEDV impact wane a bit with vaccines, better management, better biosecurity, etc., thus allowing us to put year-on-year increases in place for this year? And in either case – what was the correct year-ago litter size? The USDA says it is 9.53 for December-February quarter even though the impact of PEDV should have been on litter size, not litters farrowed. More shooting in the dark. Or at least deep twilight! We’ll all do our best.
The key numbers from the report appear in Figure 1 and 2. Some of their implications are: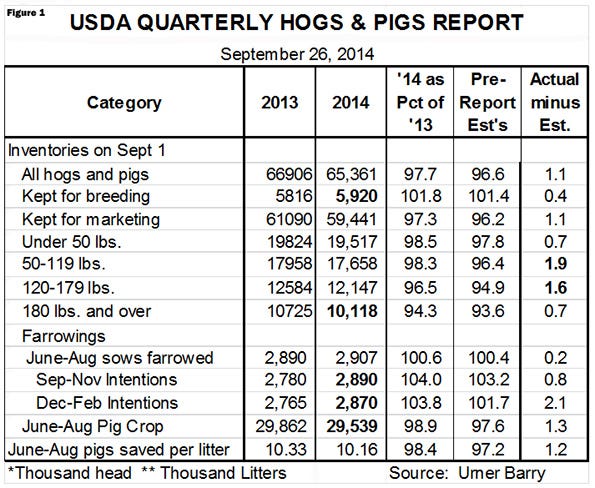
Pigs kept for marketing number 59.441 million, 2.7% lower than one year ago. Analysts had expected that figure to be down 3.8% so this report included about 654,000 more pigs headed for market over the next six months than were expected.
Pigs weighing 180 lb. and more on Sept. 1 numbered 10.118 million head, 5.7% lower than one year ago. Slaughter since Sept. 1 is down 6.3% so this number appears reasonably accurate – and definitely accurate enough to not cast any doubt on the report.
The total inventory of pigs weighing from 50 to 179 lb. – pretty much all of the pigs that will come to market in the fourth quarter – was 29.805 million, down 2.4% from one year ago.
A breeding herd 1.8% larger than last year. That is slightly larger than analysts were, on average, expecting and a number that, given the size of sow slaughter, implies a high level of gilt retention this summer.
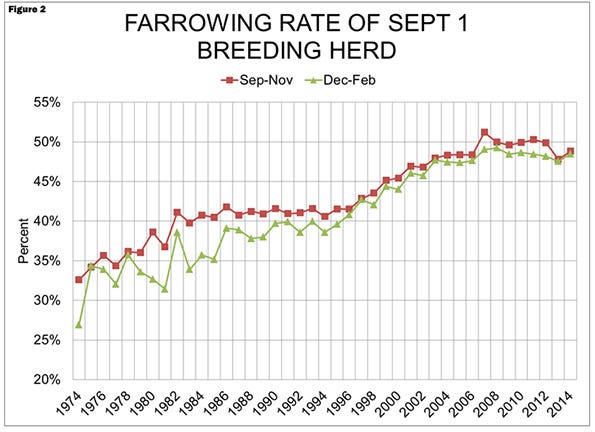
Farrowing intentions of 104.0% and 103.8% of year-earlier levels the next two quarters. At first glance, those figures appear high from a 101.4% breeding herd but Figure 2 shows that both are well within reason from a historical viewpoint. In fact, the September-November farrowing rate of 48.8% of the breeding herd remains well below the roughly 50% level witnessed consistently before 2013.
Average litter size (pigs saved per litter) of 10.16 for the June-August quarter is 1.6% lower than one year ago, but sharply higher than the past two quarters. This figure along with June-August farrowings of 100.6% of 2013 put the June-August pig crop at 29.539 million head, still 1.1% lower than one year ago, implying slightly lower slaughter in the first half of 2015.
 So what will be the impacts? We have 2014 fourth quarter commercial slaughter at 28.9 million head, 3% lower than one year ago. That number is slightly larger than the mid-weight inventories suggest, primarily because we still think the USDA has under-estimated the impact of PEDV a bit. That miss is getting smaller but it is not zero in our opinion.
Slaughter in the first quarter of 2015 will be about 1% lower than one year ago and second quarter slaughter could be up 4-5%. Third quarter slaughter will be up about the same as the second quarter. The critical factor will be the change in litter size.
With those kinds of increases, hog prices will be sharply lower than those of 2014 but let’s remember where we are starting this descent. The average national net negotiated price in first quarter of 14 was $92.46. The 2015 first quarter price will be slightly lower than that as higher market weights will offset the slight decline in hog numbers. The prices for second quarter and third quarter were $116.83 and $114.84. Five percent increases in hog numbers and another 1-2% on weights would put prices down 12-20%, depending on the elasticity of demand, but that would still leave them at $92-$102 when costs will be in the mid-$60s.
The industry is clearly growing and likely poised for more growth. That should be no surprise given the levels of profits forecast for 2015. Higher 2015 supplies will push prices lower but not nearly as much as costs have declined. My hog model shows 2015 costs down 17.3% from 2014 and 30% from 2013. Even with the expected damage that this report will do to lean hogs futures on Monday, profits will remain near $40 per head, their second highest level on record.
We will include our table of supply and price forecasts in next week’s “Weekly Preview.”
You May Also Like
Enter a zip code to see the weather conditions for a different location.