

Subscribe to Our Newsletters
National Hog Farmer is the source for hog production, management and market news
Many of our fears about an export debacle this fall – at least when compared to last year -- were allayed on Friday when USDA released data that indicate this was the best October in history.
December 17, 2012

Many of our fears about an export debacle this fall – at least when compared to last year -- were allayed on Friday when USDA released data that indicate this was the best October in history. October’s U.S. pork export figure was 492.984 million pounds, carcass weight equivalent. That is the third-largest monthly total on record, falling short of only November and December 2011 and January 2012. As Figure 1 shows, the October total was well above the 2004-2007 trend line that I have used for some time as a benchmark for U.S. pork export success.
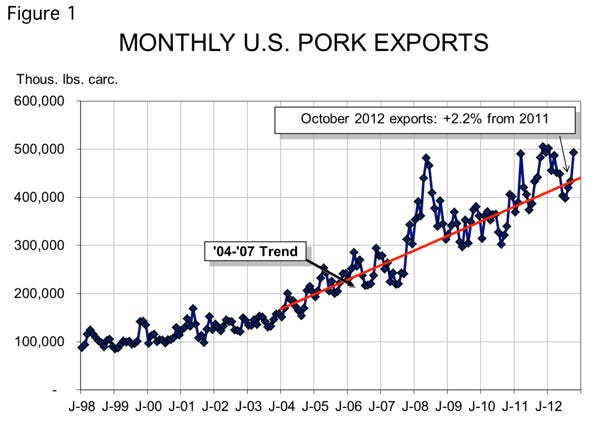
The October figure was 2.2% higher than one year ago and brings year-to-date exports to 4.49 billion pounds, 7.1% higher than last year and only 699.3 million pounds short of the 2012 year-long total. Since we have had little bad news – save the situation with Russia that began last week – it is a virtual certainty that we will break last year’s export record of 5.189 billion pounds, carcass weight equivalent.
October’s shipments represented 22.3% of U.S. commercial pork production; 2012 exports through October accounted for 23.4% of U.S. commercial production. Readers will see higher figures coming from the U.S. Meat Export Federation and should note that those percentages include pork variety meats. My calculations here include only pork cuts on a carcass weight equivalent basis.
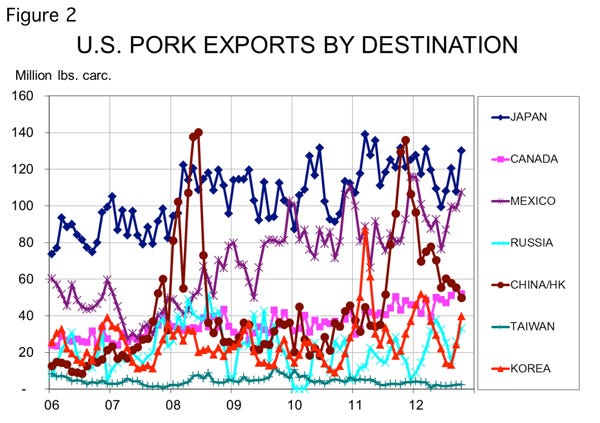
Japan remains our largest export market and took over 20% more U.S. pork in October than it did in September. October 2012 exports to Japan were actually lower – by just 1% -- than last year. Year-to-date shipments to Japan are now 5% below 2012 levels.
As expected, exports to China/Hong Kong fell far short (by 62%) of last year’s remarkable levels. Year-to-date exports to China/Hong Kong are still 16.5% larger than last year, but will almost certainly fall below last year’s pace when November data are released. We knew these shortfalls were coming so they should be no surprise.
The encouraging part of last week’s report is the large month-to-month gains in shipments to Canada, Mexico, Russia, South Korea and other markets. October shipments to those markets were also substantially higher than one year ago with Canada increasing by 20%, Mexico growing by 33%, Russia taking 76% more product and Korean purchases increasing by 92% (Figure 2).
The value of pork shipments increased 0.3% vs. October 2011 to reach $505.069 million. That is the second-highest monthly total on record and implies a slight reduction in per unit prices since the percentage increase in value is less than the percentage increase in volume. That is no surprise either given the higher-than-expected slaughter runs of late summer and early fall. The total value of U.S. exports, year-to-date, stands at $4.539 billion, up 5.4% from 2011.
The value of October pork variety meat exports was $85.238 million, 53% more than last year. That figure implies much better variety meat prices this year since October export volume grew by “only” 26%.
The total value of pork, pork variety meat and sausage casing exports in October was a record $603.7 million, 5.9% higher than one year ago. It brings the 2012 year-to-date total to $5.241 billion, 6.3% higher than last year at this time and only $867 million short of the total for the entire year of 2011.
On the Other Hand
You knew that was coming, didn’t you? A large increase in exports usually means a disappointing change in domestic per capita consumption and that can mean softer demand. And that is just what happened in October.
The average nominal pork price for the month was $3.484/lb., 0.46% higher than one year ago. Inflation contributed to that increase, though, and October’s deflated pork price was 1.7% lower than one year ago. If domestic pork demand is steady, that price decline would accompany a 1.25% increase in per capita consumption. October’s actual increase was only 0.98%, due largely to those excellent exports, meaning demand was not stable – actually falling by 0.27% compared to one year ago.
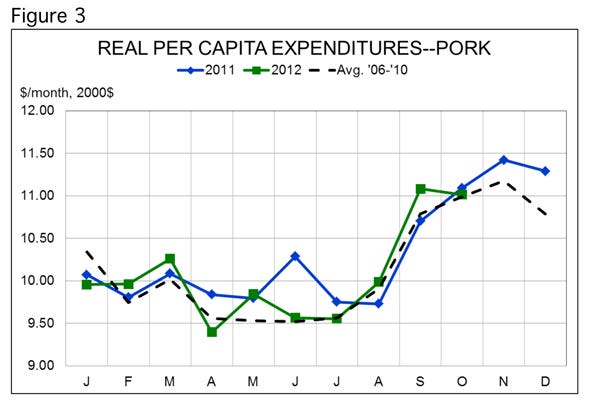
Figure 3 shows monthly real per capita expenditures (RPCE) for pork were $11.01 in October. RPCE is a proxy for the demand index. October RPCE was 0.7% below last year, but remained 0.22% above the average for 2006-2010. Year-to-date RPCE for pork stands at $100.62, 0.5% below last year’s $101.16. For the 12 months ending in October, RPCE for pork is $123.33, 0.35% lower than the $123.76 for the same period one year ago.
My conclusion is that pork demand is not great, but it’s certainly not bad given the mighty struggles of the U.S. economy this year. Pork held its own in this environment in October, capturing 25.5% of the total RPCE for pork, beef and chicken. That is up from last year’s 25.1% and exceeds the 2006-2010 average of 24.2%.
You May Also Like
Enter a zip code to see the weather conditions for a different location.


