

Subscribe to Our Newsletters
National Hog Farmer is the source for hog production, management and market news
September 8, 2014

July exports data, released on Thursday by the U.S. Department of Agriculture’s (USDA) Foreign Agricultural Service (FAS), indicated some softening of the U.S. pork industry’s foreign business but also pointed to continued strong domestic consumer-level pork demand.
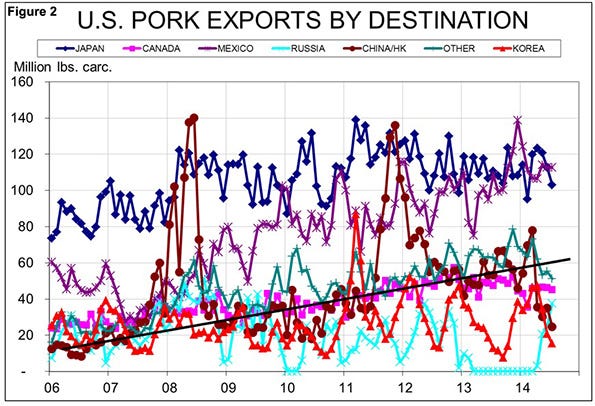
Table 1 shows July and year-to-date 2014 pork export data for top U.S. markets in both product weight and value. Figures 1 and 2 show carcass equivalent export tonnage from the USDA’s Economic Research Service (ERS). The two data series never match perfectly but they are highly correlated. Only the FAS data include values for monthly exports.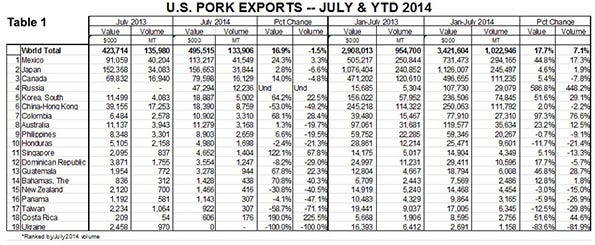
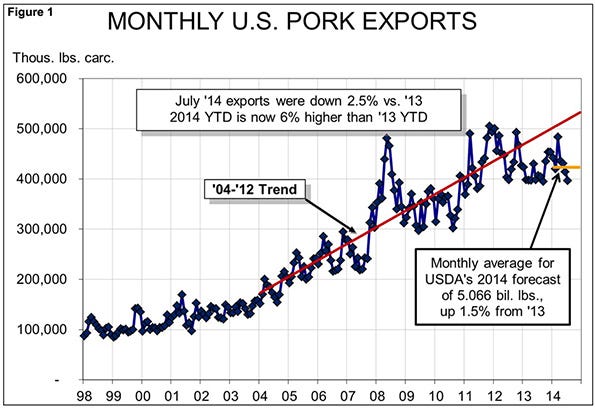
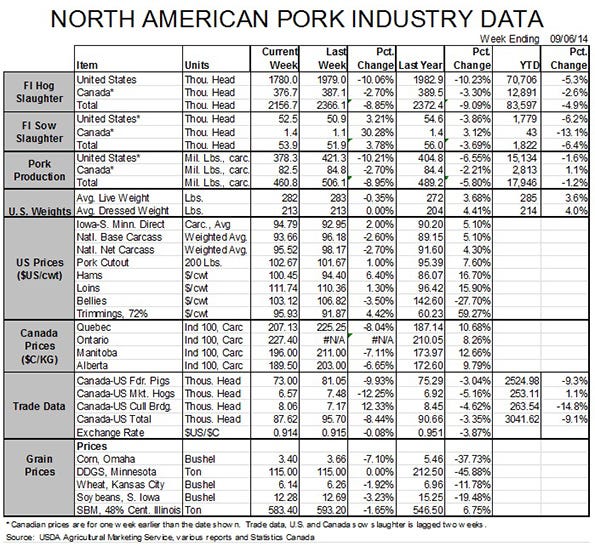
 July pork exports fell short of year-ago levels by 1.5% in product weight and 2.5% in carcass weight equivalent. The July carcass weight total was 4.4% smaller than in June and is among the lowest monthly export figures since early 2011.
The value of U.S. pork exports in July remained quite high relative to last year. Shipments were valued at $495.5 million, 16.7% more than in 2013 despite lower monthly tonnage. The month’s excellent value performance brings year-to-date pork export value to just over $3.4 billion, nearly 18% larger than one year ago. The high value figures tell us that per unit pricing on exports has been strong – as one would expect given the strength of domestic wholesale pork markets.
Mexico was the largest market for U.S. pork in August, taking 41,549 metric tons. That figure is almost a third larger than second-place Japan and is 3.3% larger than one year ago. More important, the value of those exports to Mexico was almost one-fourth larger than last year. While Mexico remains a price-sensitive market, buyers there have “paid the price” to keep U.S. product coming as Mexico’s domestic supplies have been negatively impacted by porcine epidemic diarrhea virus (PEDV). We hear that the PEDV situation there is even worse than here in the United States. Will winter – or what there is of winter in Mexico – make a difference there?
Mexico has opened a sizeable (about 50,000 metric tons or 20%) lead on Japan in product weight terms this year. ERS’s carcass equivalent data shows the race close with Japan holding a slight advantage. We think it is likely that Mexico will be our No. 1 muscle cut market this year. Japan still holds a huge lead in the value column. A big reason for that is Japan’s gate price mechanism that basically forces their imports toward higher-price products. A key “watch” item for the future will be Trans-Pacific Partnership discussions as a successful agreement will almost surely eliminate that layer of protectionism.
The July data show huge percentage gains for sale to Russia primarily because last year’s numbers (i.e. the denominators in the percentage change formula) were quite close to zero. This, of course, was before Russia imposed import embargos on the United States over the ongoing Russia-Ukraine political-military standoff. Note also that shipments to Ukraine have gone to practically zero as Ukraine ceases to be a back door into the Russian market.
Note also in Figure 2 that the June and July totals have fallen well below the average monthly export level that would result in annual exports meeting the USDA’s 2014 forecast of 5.066b billion pounds, carcass weight. That level would represent growth of 1.5% from 2013. The USDA’s 2015 forecast stands at 5.145 billion pounds, up another 1.6%.
The July export data are also the last piece of the computational process to determine the status of domestic pork demand and the news on that front remains good indeed. Real per capita expenditures (RPCE) for pork fell slightly from July but, at $10.77 in year-2000 dollars remain 5.6% higher than one year ago. The month’s expenditures leave the year-to-date figure at $76.50 in year-2000 dollars. That figure is 6.8% (nearly $5 per person) higher than one year ago. Continuing a long-standing trend, the real (deflated) pork price (+9.3% year over year) more than made up for lower (-3.4%) per capita consumption in July.
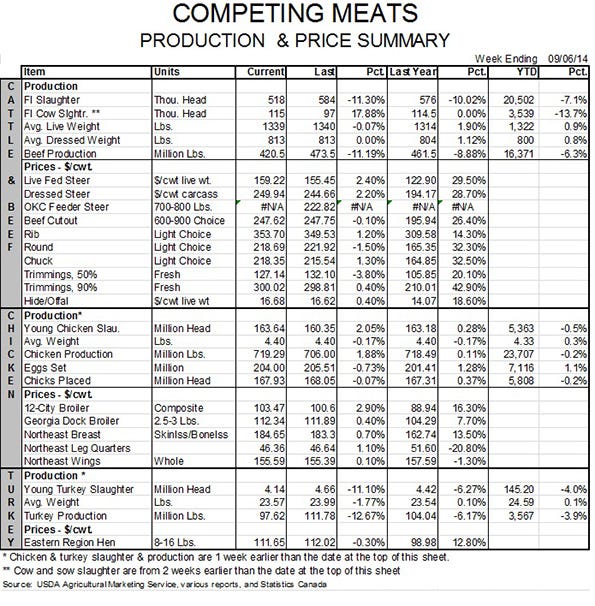
Pork remains the star among the four major meat/poultry species. Beef is still having a good year with year-to-date RPCE up 3% but July’s year-on-year change fell to 2.3%, its lowest level since February. Chicken’s RPCE was lower than one year ago for the second time in the past three months pushing year-to-date RPCE for chicken below its 2012 level by 0.2%.
Turkey’s RPCE fell short of the year-ago level in July – as they have in every month this year – and the shortfall was big: 11.4%. It leaves turkey’s RPCE down 5.8% for the year as both per capita consumption and real retail price continue to run lower than one year ago.
Total RPCE for the four major species remained higher than last year in July but the gap narrowed substantially to just 1.2%. That reduction leaves year-to-date RPCE for the four major species at $310.84, 2.8% higher than one year ago and 6.1% (over $17/person) higher than the average year-to-date figure for July from 2009 through 2013.
Though meat/poultry demand figures slowed a bit in July, it still appears strong – and that is especially true for pork.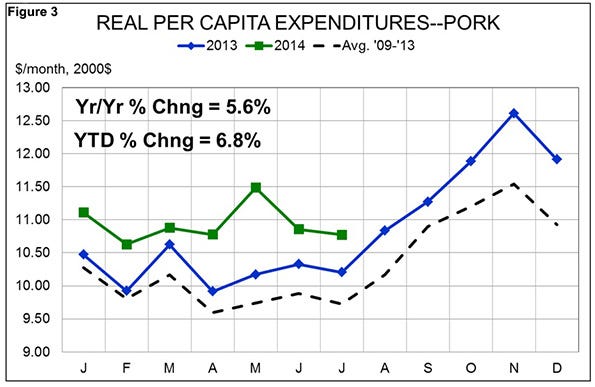
You May Also Like
Enter a zip code to see the weather conditions for a different location.


