Subscribe to Our Newsletters
National Hog Farmer is the source for hog production, management and market news
October 7, 2013

This month we are looking at performance by farm size related to parity. This is the second part of our three-part series that comes from farms in Ohio. In this article, we will evaluate piglet death loss by lactation day by farm size.
The data used for these articles is taken from 48 farms totaling 112,432 mated females, which are part of our In-Depth Farm Analysis database. Size of farms in this data set ranged from 600 to 5,700 females. For this analysis, the farms had be 26+ pigs weaned/mated female/year for the last 52 weeks and had to have entered piglet death losses by the day of lactation. We then sorted the farms by size. We used this information to estimate the number of employees on the farm in order to determine if the size of the farm and the number of employees has an effect on performance:
Group 05 – 4,000+ mated females - 5 farms - 13+ employees
Group 04 – 3,000 – 3,999 mated females - 12 farms - 9 - 13 employees
Group 03 – 2,000 – 2,900 mated females - 10 farms - 6 - 9 employees
Group 02 – 1,300 – 1,999 mated female - 11 farms - 4 - 6 employees
Group 01 - 600 – 1,299 mated females - 10 farms - 2 - 4 employees
To study this issue further, we would like to perform a very detailed analysis of the impact of the number of employees on sow performance, even down to the number of minutes of labor per pig weaned. If you have or know of a farm that would share that kind of detailed information, contact SMS.
We left Table 1 in the article from the first article on this topic. You will notice that Total Born/Mated Female/Year by size of farm does not vary much with Group 01 (farms 600-1,299 females) having the top number at 35.36 pigs. However, when you look at Pigs Weaned/Mated Female/Year, Group 05 (farms 4,000+ females) were at 30.09 pigs with Group 01 at 28.03 pigs. The biggest drop in performance is Group 03 (farms 2,000-2,900 females) at only 26.97 pigs.

Table 2 Total Born/Female Farrowed is broken out by parity from Parity 1 to Parity 7+. Total born average for all parities shows Group 03 at a high of 14.36 pigs to a low for Group 4 at 13.96 pigs. Several different genetic companies are represented in this data set of 48 farms.
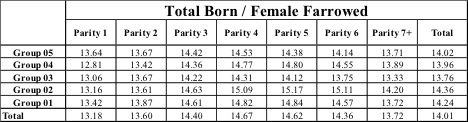
Looking back at P1 females, the Group 05 farms had the highest number of total pigs born/female farrowed at 13.64 pigs with Group 04 down to 12.81 and Group 01 at 13.42 pigs.
Why did the largest and smallest grouping of farms have the best start to P1 females? In our opinion, it is due to the commitment of the employees for the smallest farms and specialized employees of the largest farms. These farms are committed to gilt development. They have invested in facilities for conditioning gilts, are committed to daily boar exposure and heat checking of gilts, recording of heat cycle, making sure gilts get crate exposure before breeding and have a minimum weight for gilts at breeding. The top-producing farms do a very good job of maximizing the number of pigs produced by the first three parities. The Group 05 farms averaged 41.73 pigs for the first three parities with Group 04 at 40.59 pigs.
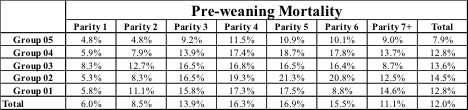
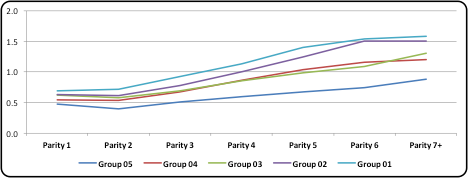
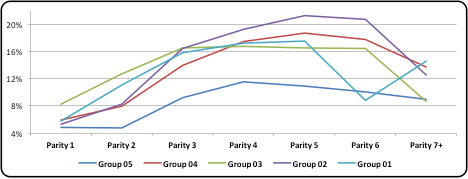
For Table 3 Stillborn/Female Farrowed and Table 4 Preweaning Mortality, we broke out these numbers by parity and size of farm. This is a reflection of farrowing house management and the ability to adjust to the increasing number of piglets being born.
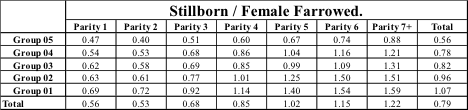
The average stillborns per female farrowed for the 48 farms is at 0.79 pigs, with Group 01 at 1.07 pigs and Group 05 at only 0.56 pigs for stillborns per female. That represents a big difference of 0.51 pigs per litter. Group 05 farms starting off with Parity 1 females are at 0.47 and P7+ females are only up to 0.88 pigs. The Group 01 farms show P1 females at 0.69 pigs increasing to 1.59 pigs for P7+ females. This difference reflects some changes in day 1 piglet care. Stillborns can be low for older parity females. What these bigger farms are able to do that the smaller ones are not able to do is have more people in farrowing to help sows with farrowing and extend the time that someone is at the farm in farrowing rooms. The bigger farms now have someone working in farrowing 24/7 helping sows.
For Table 4 Preweaning Mortality, the average by parity for the 48 farms is at 12.0% with Group 02 (farms with 1,300-1,999 females) at 14.5%, down to 7.9% for the Group 05 farms. When looking at preweaning mortality by parity, notice the P1 females are the lowest with mid-parity females being the highest. Here again the difference in results is due to day 1 pig care – getting those pigs dried off as soon as possible after farrowing, getting them attached to a teat, and doing split suckling to make sure every pigs gets as much colostrum as possible that first day of life. This means committing labor to the farrowing rooms probably more than 8-9 hours per day.
Charts 1-3 Total Born/Female Farrowed, Stillborns, and Preweaning Mortality are charted by parity. Chart 1 shows the typical increase in total born as the sows mature and dropping off with the older parity females. There appears to be a lot of difference in total pigs born by parity between Group 03 and Group 02 females.
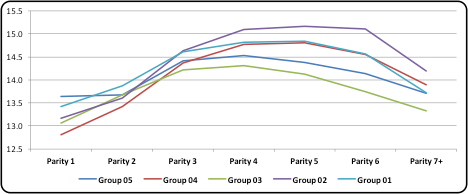
Chart 2 does show the Group 05 (farms with 4,000+ females) keeping stillborns low across all parities with the Group 01 farms having the most.
In Chart 3, the Group 05 farms are keeping preweaning mortality low, with Group 02 farms showing the mid-parity females are absorbing up to 20+% death loss.
In the future, the farms with the highest pigs weaned/mated female/year could be the large farms with 4,000+ females. In that instance, the mid-sized farms must review what is important and understand that by adding or moving more labor into farrowing, they can save more pigs. On your farm, it may take a complete reworking of standard operating procedures in the farrowing house and rethinking the true staffing needs of the farm.
Previous Production Preview columns can be found at www.nationalhogfarmer.com. If you have a topic that you would like us to address in this column, just send us a note.
Key Performance Indicators
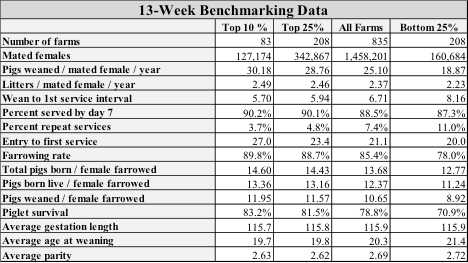
Until the benchmarking data base is rebuilt, we will continue to use the old one for the data for Tables 5 and 6 (below), which provide 52-week and 13-week rolling averages for key performance indicators (KPI) of breeding herd performance. These tables reflect the most current quarterly data available and are presented with each column. The KPI’s can be used as general guidelines to measure the productivity of your herd compared to the top 10% and top 25% of farms, the average performance for all farms, and the bottom 25% of farms in the SMS database.
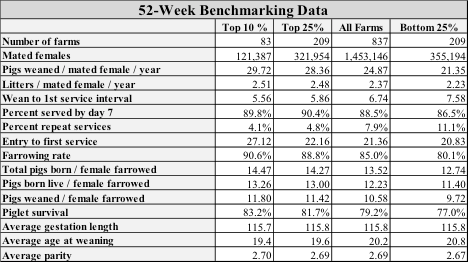
If you have questions or comments about these columns, or if you have a specific performance measurement that you would like to see benchmarked in our database, please address them to: [email protected]or [email protected].
You May Also Like
Enter a zip code to see the weather conditions for a different location.