Subscribe to Our Newsletters
National Hog Farmer is the source for hog production, management and market news
As the U.S. pork industry faces mounting pressure to abandon gestation stalls, we decided to take a closer look at how sows perform in three common housing alternatives — stalls, pens and pens with electronic sow feeding (ESF).
May 15, 2012

As the U.S. pork industry faces mounting pressure to abandon gestation stalls, we decided to take a closer look at how sows perform in three common housing alternatives — stalls, pens and pens with electronic sow feeding (ESF).
To ensure we had representative samples in each of the three sow-housing categories, we reached out to several genetic companies, equipment suppliers and others in the industry for data to supplement the Swine Management Services database.
Several productions systems willingly shared their sow performance data and offered valuable comments about their experiences. We appreciate their assistance and thank them for sharing their knowledge with others in the pork industry.
At the outset, it is important to point out that this is by no means a research trial, but rather a compilation of performance data from farms located across the United States and Canada. Obviously, climate conditions, genetics, management style, facility age and design cannot be standardized.
Of the 786 farms that shared data, 509 farms were selected for this database comparison. Farms had to be in full production for three years with an average of at least 22 pigs weaned/mated female/year (PW/MF/Y), with no quarter under 20 PW/MF/Y. This prescreening took out most of the variation caused by startup farms, repopulation farms and farms with major disease challenges.
Farms were divided into categories as follows:
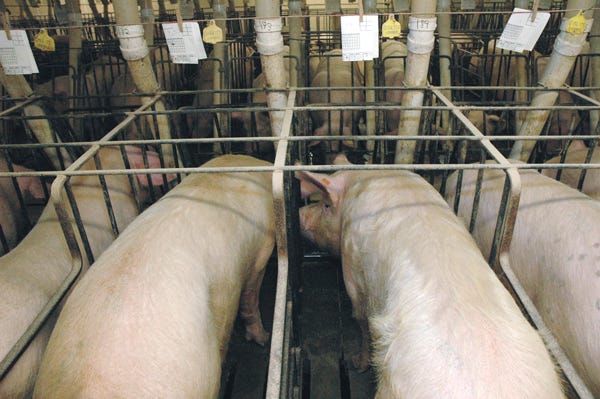
• Stalls — sows housed in stalls for the entire gestation period (below).
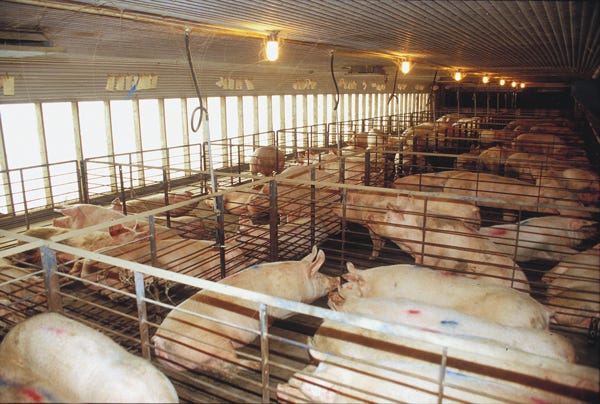
• Pens — sows housed in stalls for 30-35 days, postbreeding, then moved to pens (below).
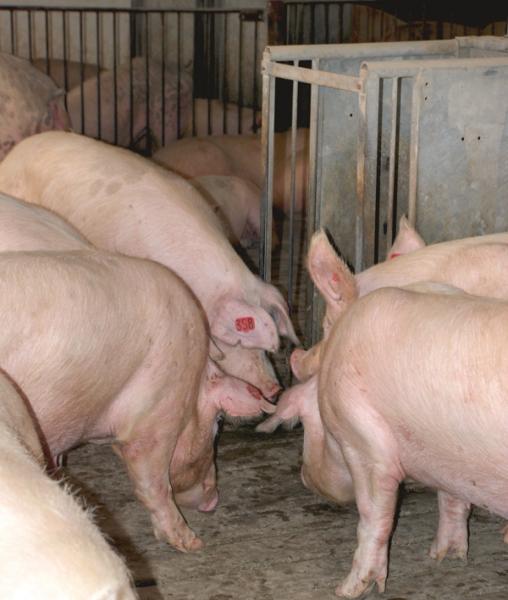
• Electronic Sow Feeding (ESF) — sows housed in stalls before grouping (below).
Group size varied for the two penning categories, ranging from 5-6/pen to over 40/pen. No allowance was made for group size in the “pen” category. And, in the ESF category, it is important to point out that some farms load pens as a static group of about 65 sows, while others have dynamic groups of up to 250 sows/pen or more. Because of the small number of ESF farms, we did not separate them by number of females per pen.
Interestingly, several producers with pen gestation or ESF groups explained they had conducted extensive research before deciding which alternative to adopt. Some said they had been working on this issue for several years. Most producers recognized the importance of using breeding stalls to house gilts and newly weaned sows until they were confirmed pregnant — usually a period of 30-35 days.
Profiling the Dataset
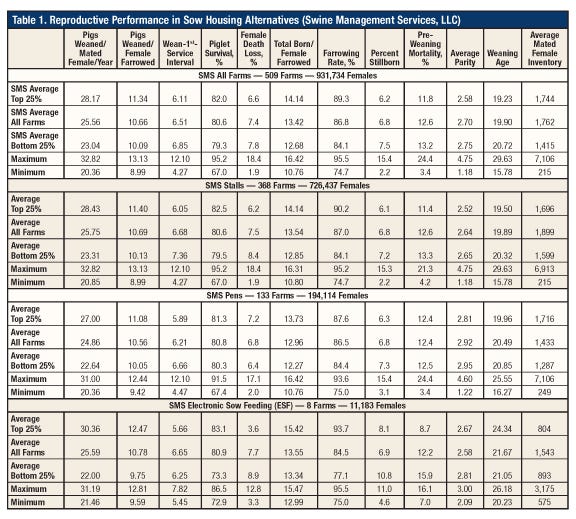
The top bracket in Table 1 (below) shows the average sow performance for a dozen traits for the full dataset representing 509 farms and nearly a million females. Using the categories outlined above, we had 368 farms (726,437 females) in stalls, 133 farms (194,114 females) in pens, and only eight farms (11,183 females) utilizing ESF technology. We were hoping to have more farms with ESF, but some were startup farms that did not meet our sort factors. We are hopeful that more ESF farms will be available for future comparisons.
Finally, to make the data more significant, we divided the datasets as follows: Average Top 25%, Average All Farms, and Average Bottom 25%.
What the Data Shows
The “all farms” data from 509 farms ranged from 20.36 to 32.82 PW/MF/Y and averaged 25.56 PW/MF/Y.
When we look at sow performance in stall systems, the range is very similar — ranging from 20.85 to 32.82 PW/MF/Y to average 25.75 PW/MF/Y.
Female performance when housed in pens ranged from 20.36 to 31.00 PW/MF/Y and averaged 24.86 PW/MF/Y.
Sows in ESF systems ranged from 21.46 to 31.19 PW/MF/Y, averaging 25.59 PW/MF/Y. Two of those farms averaged more than 30 PW/MF/Y.
All things considered, there is very little difference in average performance between groups, but there is a lot of variation within the groups.
Looking closer at a few key performance indicators, we see the average total pigs born/female farrowed is 13.54 for stalls, 12.96 for pens and 13.55 for ESF, with an all-farm average of 13.42. The calculation is total pigs born/total females farrowed. This data point is a measure of litter size before crossfostering and excluding nurse sows.
Farrowing rates were fairly similar across groups, with females in stalls averaging 87%, pens averaging 86.5% and ESF averaging 84.5%. All farms averaged 86.8% farrowing rate.
Female death loss averaged 7.5% in stalls, 6.8% in pens and 7.7% in ESF housing, with the widest range in stalls.
Finally, we took a closer look at stillborn rates. Sows housed in stalls and pens averaged 6.8%, while those in ESF averaged 6.9%. Stillborn ranges were similar in stalls and pens, but wider in the eight ESF farms, which ranged from 4.6 to 11%.
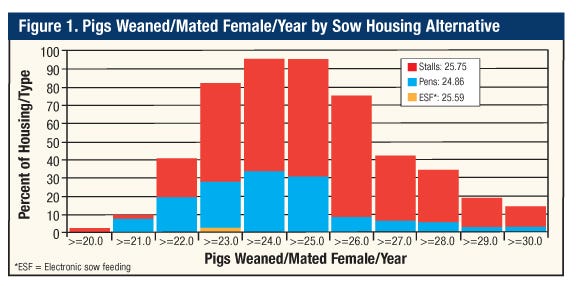
Figure 1 (below) provides a graphic illustration of PW/MF/Y and shows the normal distribution of the datasets. Farms with stalls (red) represent 368 farms with a 25.75-pig average, farms with pens (blue) represent 133 farms averaging 24.86 PW/MF/Y and the eight farms equipped with ESF (yellow) averaged 25.59 PW/MF/Y.
Housing Considerations
Again, this is a snapshot of sow performance in three sow housing options. Key decisions each farm has to make when considering sow housing alternatives include:
• Cost to make the change.
• Female inventory (sq. ft./female and sow numbers, thus weaned pig production).
• Postweaning breeding stalls (commonly 30-35 days).
• Number of females per pen.
• Managing boss sows, injured females or health-challenged females.
• Facility considerations — flooring (solid, slats), gating, water and feed delivery (floor, trough, ESF), etc.
• Ventilation and cooling options.
Three of the biggest hurdles when retrofitting an existing farm include what to do with the current sow inventory during the remodel, biosecurity to keep disease out and the ability of the current staff to adapt to management practices if changing from stalls to pens.
As the data shows, under the right management, any of the sow housing alternatives can be productive.
We plan to periodically run these performance comparisons to help producers make good decisions about gestation housing. If you would like to have your data included in the data set, contact Ketchem at [email protected] or Rix at [email protected].
You May Also Like
Enter a zip code to see the weather conditions for a different location.


