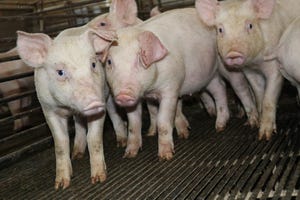
There is some movement in the industry to weaning older pigs to see better performance in nursery and reduce feeding a lot of the expensive nursery diets. However, that reduces the turns of the farrowing crates increasing the facility cost per pigs weaned.
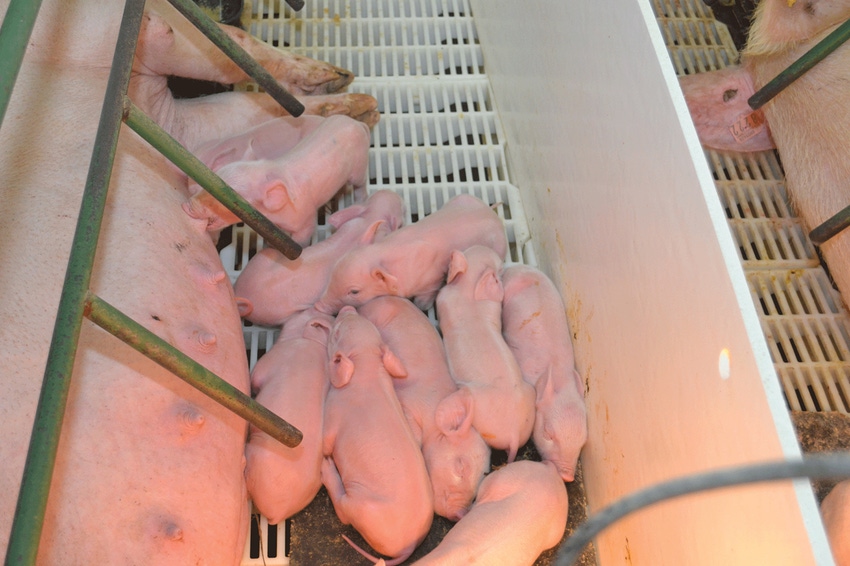
In the column “What is the right age to wean pigs?”, we discussed how lactation length affects subsequent sow performance. We have recently been asked about the variation in lactation length in farms so this column will explore that.
Why is variation important? We demonstrated where sows perform the best in the above-mentioned column and that is one reason. The other reason is maybe even more important and that is about getting the pig started well and setting them up for success in the grow-finish phase.
Chart 1 looks at the percentage of pigs weaned by age over a two-year time period on 25 farms. We looked at sows that weaned five or more pigs and had a lactation length of 10 to 30 days. Some farms have a rather low peak while others are very high; 49.9% of the pigs in these farms were weaned at 18 to 21 days of age.
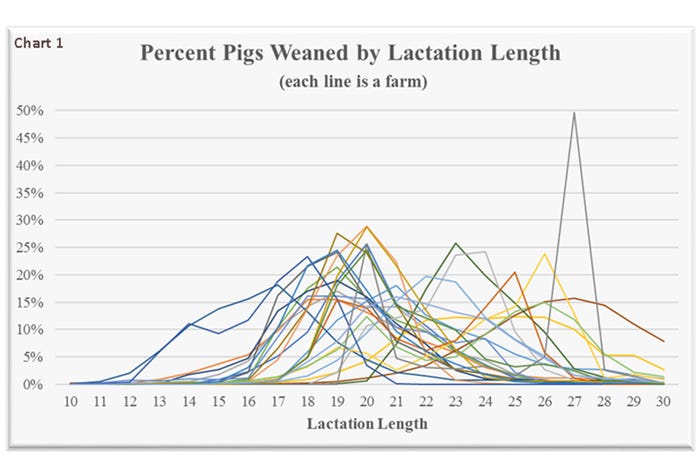
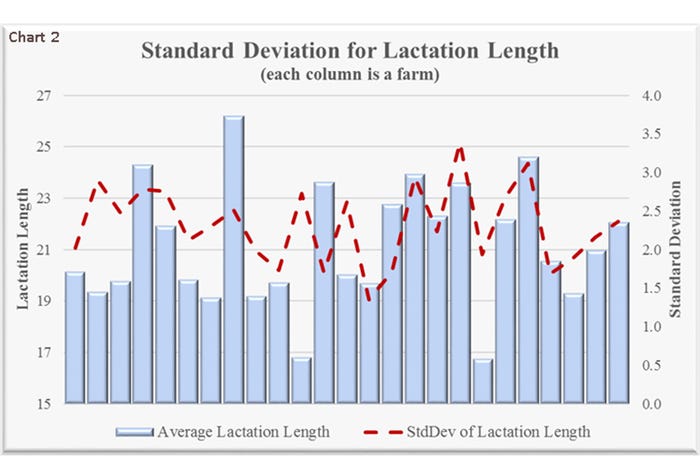
Looking at the same 25 farms the average lactation length was 21.04 days on those farms, they ranged from 16.76 to 26.17 days. While there is a lot of variation between farms what is even more important is the variation within the farm. Standard deviation is a measure used to describe how spread out a measurement is from the average, a low standard deviation means that most of the numbers are very close to the average while a high standard deviation means they are spread out, and more variation.
When we look at the standard deviation of wean age it averaged 2.3 on those 25 farms but ranged from 1.4 to 3.4. Chart 2 shows the average lactation length (blue bars with left axis) and the standard deviation (red line with right axis) over the time period for each of the 25 farms.
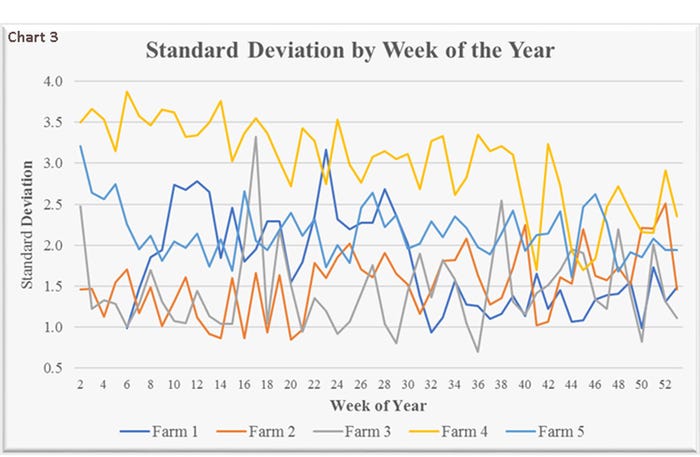
Taking it a step further we look at the standard deviation of five farms based on the week of the year for a 52-week time period. There is a lot of variation on a week-to-week basis depending on the farm. Chart 3 shows the variation by week for those farms. Farm 4 is a once-a-week weaning farm while the other four farms wean twice per week. Farm 3 had the widest spread in standard deviation with a low of 0.7 and a high of 3.32. While Farm 5 had the narrowest spread over the 52 weeks of 1.16 to 3.2. For most farms, the driver of variation is all related to how many sows are going through farrowing and how well the spaces are being managed.
The best farms, weaning twice per week, average 1.5 Standard Deviation or 95%+ of the pigs weaned in a six-day period and 75%+ in a four-day period. There are fewer farms that wean once a week now. For those a Standard Deviation of 2.2 would mean 95% of the pigs are weaned in a 10-day period and 75% are weaned in a six-day period.
What tools a producer has to reduce the variation in wean age depends on the health of the farm in most cases. If a farm is healthy the biggest thing they can do is to move sows to tighten rooms. Load the farrowing rooms by the previous gestation length for each sow versus projected farrowing days is another tool. There is always that sow(s) that farrows in the next room before this current room is finished. For producers who are only weaning once per week doing some strategic induction can help to finish up a room, that would be inducing based on the genetics of your farm. Starting a 14-day-old pig in a new environment is much more challenging that starting a 21-day-old pig.
There is some movement in the industry to weaning older pigs to see better performance in nursery and reduce feeding a lot of the expensive nursery diets. However, that reduces the turns of the farrowing crates increasing the facility cost per pigs weaned.
What does the standard deviation look like for your farm? How consistent is it from week-to-week? What can you do to improve it to produce a better pig and improve subsequent sow performance?
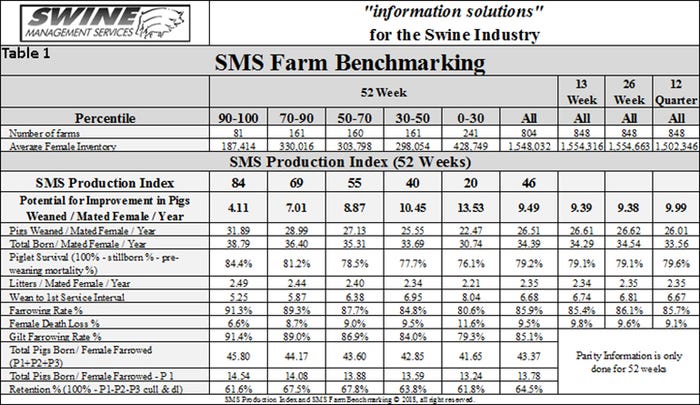
Table 1 provides the 52-week rolling averages for 11 production numbers represented in the Swine Management Service Production Index. The numbers are separated by 90-100%, the 70-90%, the 50-70%, the 30-50% and the 0-30% groups. We also included the 13-week and 26-week and 12 quarter averages. These numbers represent what we feel are the key production numbers to look at to evaluate the farm’s performance.
At SMS, our mission statement is to provide “Information solutions for the swine industry.” We feel with the creation of different SMS Benchmarking databases for all production areas we now have more detailed information to share with the swine industry.
If you have questions or comments about these columns, if you have a specific performance measurement that you would like us to write about or If your farm would like to be part of the SMS Benchmarking databases, contact Mark Rix, Ron Ketchem or Valerie Duttlinger.
We enjoy being a part of the NHF Daily team. Previous columns can be found at NationalHogFarmer.com.
About the Author(s)
You May Also Like
