Do we need to be doing better diagnosis of deaths and culls, reviewing nutrition and management of gilts and younger parity females?
October 5, 2022
The swine industry continues to see increasing female death loss and culling of younger parity females over the last several years. There have been a lot of individuals, companies and groups looking at the reasons why and trying to come up with ways to lower both these numbers with many articles written. This article will be sharing data from two databases: SMS (Swine Management Services) and MetaFarms.
The first three charts are from the SMS database which includes 282 farms with average female inventory of 600,849 females, mated female inventory of 571,079 (which takes out unbred gilt pool), pigs weaned/mated female/year at 28.41, replacement rate at 56.61%, culling rate at 46.13% and death loss at 10.72%. Farms selected for the data set had to be over 20 pigs weaned /mated female/year for the last 12 quarters with data being last four quarters.
Chart 1: Percent female inventory by parity shows parity structure of these 282 farms with P0 unbred and P0 mated females being 20.73%, P1 at 19.44%, P2 at 15.63%, P3 at 12.99%, P4 at 10.50%, P5 at 8.42%, P6 at 6.15% and P7+ at 6.13%. Is this the ideal parity structure? How does your farm(s) compare? An observation is that as more young females are culled or die on farms; they now have fewer parity P3-5 females which are the most productive females.
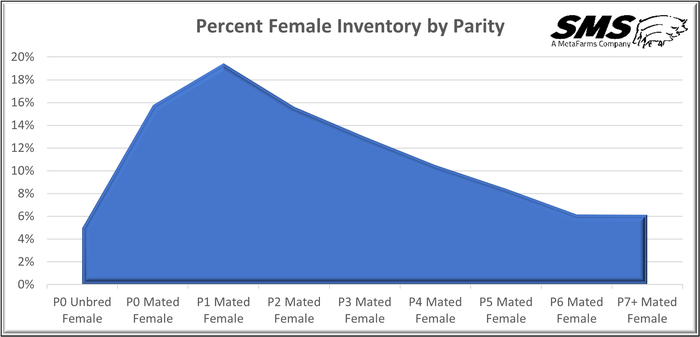
Chart 2: Percent female culling by parity has the breakout for the last 52 weeks for 276,397 culled females showing all farms at a 46.13% culling rate. The data broken out for the culls by parity shows P0 at 5.48%, P1 at 5.48%, P2 at 4.45%, P3 at 4.32%, P4 at 4.30%, P5 at 4.72%, P6 at 5.52% and P7+ at 10.94%. Please note that 16.34% of the culled females are P0-P2 females however, when converted to percent of total culling, they are 35.4% of all females culled. What does your farm(s) show for percent females culled by P0-P2?
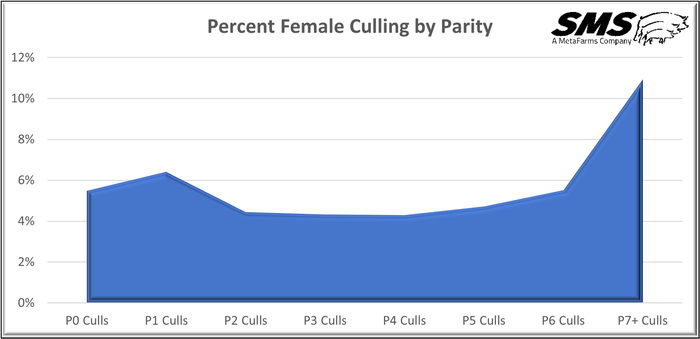
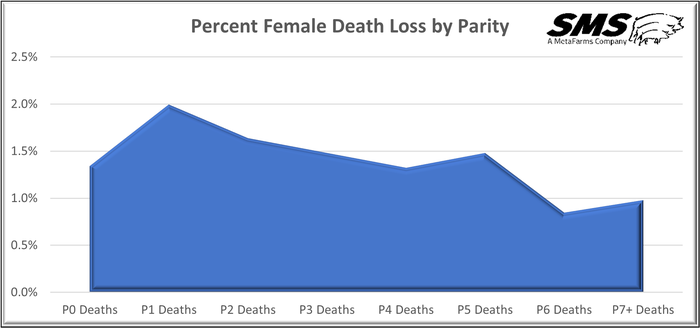
Chart 3: Percent female death loss by parity shows the 282 farms over the last 52 weeks had 64,242 female deaths which is 10.72% female death loss for all the farms. When breaking the 64,242 female deaths out by parity, P0 at 1.34%, P1 at 1.99%, P2 at 1.64%, P3 at 1.48%, P4 at 1.32%, P5 at 1.48%, P6 at 0.85% and P7+ at 0.98%. There is a big concern when you convert female deaths as a percent of all the deaths you see that 46.4% of all deaths are P0-P2 females. This is a big problem when almost 50.0% of all deaths are the younger parity females which has cost the farm a lot of money to purchase and develop but are then going into compost. What percent of your P0-P2 females are dying? If you add the 35.4% culls and 46.4% deaths together, you see 81.8% of females in the farm do not see their third parity. What is you farm doing to get more females to older parities?
The other data set was from MetaFarms looking at females that were culled, died and euthanized (destroyed) for a three-year period starting July 2019 and ending June 2022. Total females culled were 1,559,496, deaths were 373,131 females, and euthanized were 172,308 females. In the MetaFarms database, female deaths are broken out into two categories: female deaths and females that were euthanized. For this article, the charts will address all three areas.
Lack of standardization of reasons for culling and female deaths continue to be an issue when trying to analyze farm data. This data set had a total of 1,134 reasons for females culled, died and euthanized. A lot of the differences come from how each farm, in most record systems, can customize their reasons. However, do to spelling errors, shortening the reason's name, and people adding just about anything they want, the list is long. SMS has promoted the standardization of reasons for years. To address standardization of reasons, an article was written back on July 27 2017, in NHF called “Time for an overhaul of removal records."
A group of professionals working with SMS came up with six categories for breaking out culling, removal and deaths: Disease/Health, Performance, Locomotion, Reproduction, Intestinal and Other. We assigned the 1,134 reasons to one of the six categories. Here are the six categories and the reasons rolled into them for this article:
Disease/Health: discharge, downer, disease, mastitis/metritis, c-section, heart attack, heat stress, infections, constipation
Performance: age, low total born, retained pig, low weaned, poor milker, behavior, body condition, off-feed, farrowing difficulties, lactation problems
Locomotion: unsound, lame/injured, feet infection, injured foot, or dew claw
Reproduction: no heat, not in pig/preg check neg, abortion, repeat service, vaginal/uterine prolapse, failed to farrow, open, no-heat
Intestinal: ulcer, off feed, gastrointestinal
Other: transfer, other, trauma, management, missing, unknown
The MetaFarms data was converted into the six categories above to be able to compare female culling and death loss. When looking at the charts, make sure you review the legion at the bottom of each chart to know the breakout of the six categories by parity with the charts set up with the highest percentage category at the bottom of each column.
Chart 4: Culls by parity breaks out the 1,559,496 culled females the last three years by the six categories and parity. This chart is set up where each parity and category are a percentage of 100%. An example of how this works is Reproduction % with P0 at 11.0% of all females culled and 37.6% of all females culled from Reproduction. When reviewing the chart trends, you see Reproduction as the main culling reason with the highest being P0 and lower as parity goes up.
Performance is low for P0 and increases as the sow matures with that being the main reason for culling P7+ females. The third category is Other which is 25.5% of all culling reasons, with P0 females being high at 5.5% and dropping for P7+ at 1.2%. Note that the other three categories: Locomotion, Disease/Health and Intestinal are very low making up only 7.1% of all females culled. Please note that when you add P0, P1 and P2 females together, you get 49.8% of all culls being these younger females.
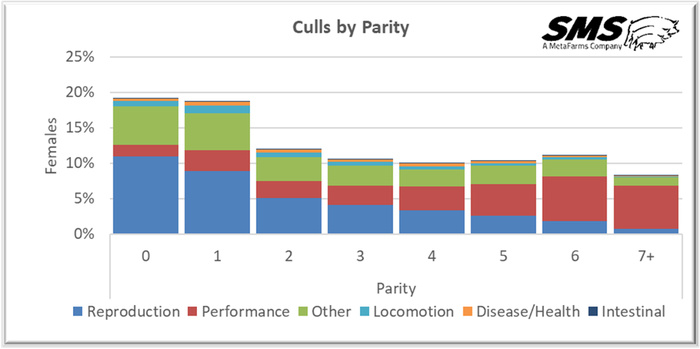
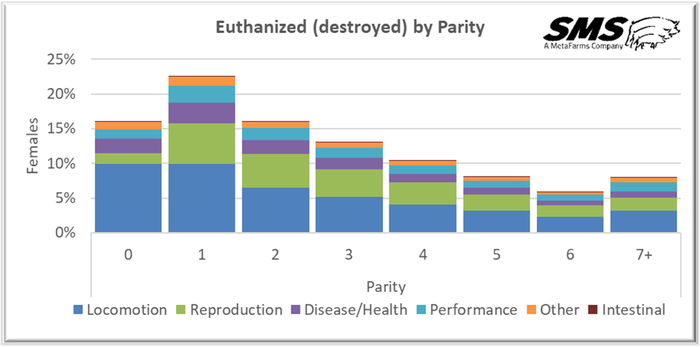
Chart 5: Deaths by parity and Chart 6: Euthanized (destroyed) by parity are both set up using the six categories listed above. Remember when you are reviewing these charts to look at the legions and see that they have a different order and color for each category.
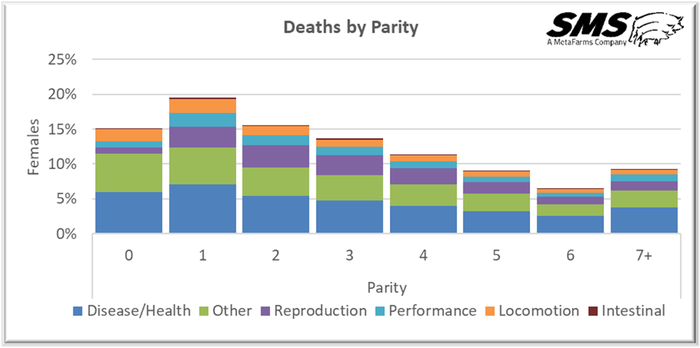
Chart 5 shows the top category for death is Disease/Health with 36.8% of all deaths being Disease/Health with 6.0% being P0, 7.1% being P1, 5.4% being P2 and P7+ at only 3.7%. The second highest category for deaths is Other at 28.1% and the third highest being Reproduction at 16.5%. The data that is problematic shows that 15.2%, 19.5% and 15.6% of the deaths are P0-P2 females which makes up 50.3% of all deaths.
In Chart 6, the one category that sticks out is Locomotion which makes up 44.3% of the 172,308 females that were euthanized with 9.9, 9.9% and 5.4% of the 44.3% being the younger P0, P1 and P2 females. The second highest category is Reproduction at 25.3%, and the third being Disease/Health at 12.5%. These three categories make up 82.1% of all euthanized females. Also, when looking at females euthanized, P0-P2 make up 54.9% of the female deaths.
When looking at the data from both databases, I continue to have some concerns about some of the trends like females culled P0-P2 for last 12 months in the SMS data set at 35.4% and for last 36 months in the MetaFarms data set at 49.8%. When you look at death loss and add the together the two breakouts for the MetaFarms data set, you get 51.6% of all deaths being P0-P2 females and last 12 months in the SMS data set at 46.4%. Another area that jumps out to me when looking at the six categories is Locomotion being 4.2% of all culls, 8.8% of deaths and up to 44.3% of all females euthanized.
What is going on? Do we need to be doing better diagnosis of deaths and culls, reviewing nutrition and management of gilts and younger parity females, reviewing with management crews how important it is to observe every female in the farm every day, and doing timely treatments to share with the crew what increased culling and female deaths are costing the farm in production and increased expenses? What is your farm doing to lower female culling and deaths?
Thank you for reading this article. If you have other topics that you would like reviewed, please let SMS know.
Source: Ron Ketchem (30 & Up Consulting LLC) and Mark Rix (SMS a MetaFarms Company), who are solely responsible for the information provided, and wholly owns the information. Informa Business Media and all its subsidiaries are not responsible for any of the content contained in this information asset.
You May Also Like


