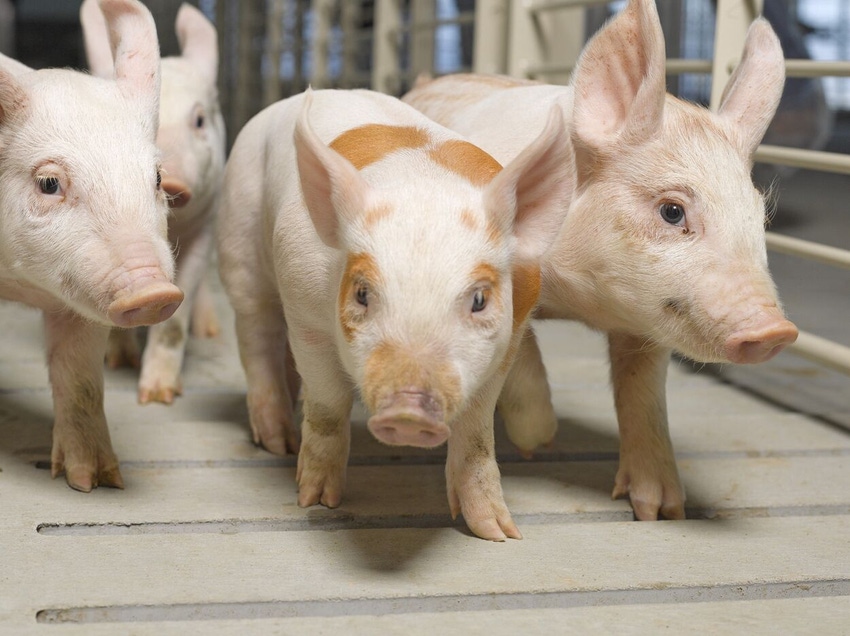
Need to to address the issue of improving piglet survivability in all areas of production, not just female death loss.
December 7, 2022

The topic of piglet survivability continues to be on the minds of most swine producers. There is not a week that goes by that an article does not appear on my computer from one of the many newsletters, digital trade magazines, university newsletters or websites providing information for the swine industry. There have been articles on improving piglet survival by lowering stillborn pigs and preweaning death loss, looking at death loss and morbidity in the nursery/finisher area, or on how sow lameness could be related to the gait of the gilts at selection time.
In this article on the topic of female death loss (euthanized), we would like to continue to promote the standardization of reasons for female deaths and culling. In August 2017, an article was published on National Hog Farmer called "It is time for an overhaul of removal records." This article was written by the SMS staff with assistance from the late Ken Stalder with Iowa State University and Chris Hostetler, director of animal science for the National Pork Board. The group suggested there be six death categories: disease/health, intestinal, locomotion, performance, reproduction, and other with more detailed reasons under each one.
These six categories were used in an article published on NHF Nov. 10, 2020, called "Understanding sow mortality to get to root causes-Part 1" with data from four farms of 85,608 sows which had 11,852 female deaths or a 10-year period. If you review the main table, you see changes over the 10 years seeing deaths from reproduction decreasing from 34% to 21% and locomotion increasing from 18% to 25% from the period 2009 to 2018.
There was a recent article published on NHF Nov. 1, 2022 "Sow Mortality: What are the main risk factors?" that had data from a large production system in the United States with data from the years of 2019-2021 with the main mortality causes being sudden deaths (30.89%), lame deaths (29.10%), prolapses (26.9%) and other causes (13.05%).
For the industry to be able to do more research and being able to dive deeper into the increasing female death loss, there must be a move to standardized reasons. Who is going to lead that charge?
This month the article is titled "Diving deeper into female deaths (euthanized)?" The six charts that follow are related to female deaths/euthanized with data from MetaFarms for a period of three years from July 1, 2019, to June 30, 2022, with 529,162 female deaths. This data set did have some questionable female deaths recorded with 5,363 females at 241+ days and one female at 5,511 days. The data for these 5,363 females were removed for this analysis. Please make sure your data is accurate before doing any in depth analysis. For the analysis charts, data from 529,162 females was used being broke out by parity from P0-P7+; six culling/death loss categories: intestinal, other, reproduction, locomotion, disease/health and performance; last event before death being: mating, arrival, treatment, abortion, farrowing/lactating, wean and open; and days to removal: 0-30, 31-60, 61-90, 91- 120, 121-150, 151-180, 181-210, 211-240 and 241+ days.
Chart 1: Percent Deaths/Euthanized by Parity and Last Event shows parity 0-7+ on the X-axis and percent deaths/euthanized on the Y-axis with data broke out by last event before death being Mating, Arrival, Treatment, Abort, Farrowing/Lactating, Wean and Open. The chart shows that 16% of deaths are P0, 21.0% are P1, 16.0% are P2 with total being 53% of all deaths are the younger females. Interesting to see that only 6% are P7+ females. The data by event shows that for Arrival (orange line), 93% of the deaths are P0 females with over 7% being other parities which are probably females transferred between farms. The chart also shows that for death at Mating (blue line), Open (grey line), Treatment (yellow line), Abort (light blue line), Wean (green line), and Farrowing/Lactating (black line), the deaths by parity are mostly equal and lower as the percent of female in farm goes down.
Chart 2: Percent Deaths/Euthanized by Reasons and Last Event is set up with the six categories for deaths: Intestinal, Other, Reproduction, Locomotion, Disease/Health and Performance on the X-axis and percent on the Y-axis broken out by Last Event Mating, Arrival, Treatment, Abort, Farrowing/Lactating, Wean and Open. Chart shows that 27.7% of all deaths/euthanized females were Disease/Health, 20.7% were Other, 20.5% Locomotion and 19.1% Reproduction. Looking at Treatment (yellow line) in detail shows 38.9% of deaths being females treated for Locomotion issues, 23.1% treated for Disease/Health and 11.3% for Other. Reproduction deaths are about 19.1% of all deaths as you would think, 31.6% occurring in Farrowing/Lactating (black line), and 22.7% after Weaning (green line). As mentioned in several articles, culling or death from locomotion problems like injury, arthritis, feet and dew claw injury, and structural unsoundness problem have been increasing and needs to be looked at in more detail.
Looking at Chart 3: Average Days to Death/Euthanized by Parity and Last Event again breaks out the 529,162 female deaths for 3 years ending June 30, 2022. Chart is set up with Parity 0-7+ on the X-axis and average days from last event to death on the Y-axis then broke out by last event before death with average days from a last event to death being 36.8 days. What jumps out on this chart is Mating (blue line) to deaths with all parities average at 76.6 days to death with a range of P1 at 78.6 days to P7+ at 73.5 days. This means females are dying in mid-to-late gestation after mated. Events Open (grey line) and Arrival (orange line) have average days at 33.7 days and 39.4 days with not a lot of variation by parity. The lowest days for death after an event was Farrowing/Lactating (black line) with average at 3.6 day with P7+ at 4.6 days and P2 and P3 at 3.1 days. This goes back to making sure sows after farrowing do not have any complications such as a retained pig. To monitor sows after farrowing, the crew in farrowing needs to taking the temperature of all sows 24 hours after farrowing and if temperature is 103+ degrees Fahrenheit, treat those sows as directed by veterinary.
Chart 4: Average Days to Death/Euthanized by Reasons and Last Event put the six categories for death on the X-axis and average days to that death on the Y-axis. When looking at last event Mating (blue line), it stands out with average days for death of females after mating being 76.5 days with female death categories of Reproduction at 104.3 days which is in late gestation, Performance at 91.3 days, Disease/Health at 7.16 days and Locomotion at 62.7 days to death. Data shows that death day is low for the events of Abort (light blue line), Wean (green line) and Farrowing/Lactating (black line) at 13.8, 9.2 and 3.7 days.
Chart 5: Percent of Deaths by Parity and Days is set up with days on the X-axis broke out by death days: 0-30, 31-60, 61- 90, 91-120, 121-150, 151-180, 181-210, 211-240 and 241+ days. The Y-axis is set up with percent going from 0-80% of deaths with data on chart broke out by parity 0-7+ litters. The chart shows that 65.6% of all deaths/euthanized in the data set were days 0-30 with 42.7% of P0 (blue line) deaths in that period up to 69.2% to 72.3% being P1-P7+ females being day 0-30. As noted in the chart, there is another jump in death days at 91-120 with 15.6% of all deaths in late gestation. There are a few sow deaths recorded at day 151 and up. Most of these are probably bad data or record keeping.
Finally, Chart 6: Percent of Deaths/Euthanized by Last Event and Days shows X-axis being average days broken out by ranges and Y-axis showing percent with range of 0-100% with data broke out by last event before deaths: Mating, Arrival, Open, Treatment, Abort, Wean, and Farrowing/Lactating. Based on last event, chart shows that 61.7% of female deaths are days 0-30 with 97.6% of Farrowing/Lactating (black line), 91.7% of Wean (blue line), 88.6% of Aborts (light blue line), 87.3% of Treatment (yellow line) and 63.1% of Open (grey line) female deaths being in the first 30 days. Last event of Mating (blue line) shows 19.4% of deaths are days 0-30, 16.6% days 31-60 days and 42.9% days 91-120 days after mating.
Female death loss continues to go up at about 0.5% per year for the last several years with some data sets showing the last year female death loss at 11+%. To summarize, the data in the charts is for 529,162 female deaths with three years of data ending June 2022 by parity shows that 16.0%, 21.0% and 16.0% of the deaths are young P0-P2 females which are 53.0% of all the deaths, with average day from last event to death being 36.8 days and if that event was Mating days, it increased to 76.6 day with deaths in mid-to-late gestation. When data was broken down by the six death loss categories it showed 20.9% was Other, 27.7% Disease/Health, 20.5% Locomotion and 19.1% Reproduction. The charts looking at range of deaths days based on last event showed 61.7% of deaths were 0-30 days after their last event. When you look at the last event being Mating, 42.9% of the deaths were days 91-120 days after mating.
Listed below are some suggestions on areas that need to be reviewed and from research, suggestions formulated to help lower female death loss and culling:
Sow lameness/injury/arthritis: procedures to help sow farms do a better job of selection of gilts as related to gait when moving and structure as to feet and legs and diagnosis for joint issues
Health of farm: looking at how diseases like PRRS, mycoplasma and other disease cause increased female death loss and what to expect during and after a health challenge
Genetic selection for longevity in females: review what genetic companies are doing to select for female robustness to help lower female death loss and movement to lose sow housing
Sow housing: what is being done for research as to flooring type, square footage and group size for sow in gestation and farrowing as farms move to lose sow housing and free stall farrowing
Nutrition: what research is being done to improve developing gilts diets, transition diets in pre-farrowing and what are needs for high producing females in farrowing
Feed ingredient quality: what do we know about the effect of mycotoxins on female development, prolapses and female deaths and what needs to be done to monitor daily feed quality or what to treat feed with to mitigate the effect of mycotoxins
Management: what is being done to train employees on selecting replacement animals, daily monitoring of females in farms and treating animals with problems
There are a lot more questions that can be generated then the ones listed. The big questions are who in the swine industry is going to step forward and get the key experts organized to address the issue of improving piglet survivability in all areas of production, not just female death loss.
Thank you for reading this article. If you have other topics that you would like reviewed, please let SMS know.
Source: Ron Ketchem (30 & Up Consulting LLC) and Mark Rix (SMS a MetaFarms Company), who are solely responsible for the information provided, and wholly owns the information. Informa Business Media and all its subsidiaries are not responsible for any of the content contained in this information asset.
You May Also Like


