If you can wean more pigs per litter, you can lower your production cost per pig produced.
This may not be the best time to look at increasing the number of pigs and if you want to look at short-term solutions for temporarily reducing your number of weaned pigs please send us an email or call us.
Two months ago, we looked at how to increase total born, last month we looked at what you need to do increase live born. This month we are looking at how to increase pigs weaned.
The book "The Goal" by Eliyahu M. Goldratt had a big impact on how I look at what I need to work on today, tomorrow, next week, next month and next year. I have these three questions hanging on the wall right over the top of my computer monitor.
What to change?
What to change to?
How to cause the change?
You should be asking yourself these three questions every day.
When you break down pigs weaned per female farrowed, there are two components: Live born per female farrowed, pre-weaning mortality. In the next three charts you will see that data broke out for the last 10 years.
Chart 1 is the Swine Management Services history from 2010 to present for live born per female farrowed. Live born for all farms in our database has gone from 11.5 pigs in 2010 to 13.4 pigs in 2020, a 1.9 pig or 16.3% improvement. The top 10% farms started at 12.4 pigs in 2010 and moved up to 14.6 pigs in 2020, a 2.2 pig or 17.5% improvement. The top 10% farms improved by 0.3 (1.2%) more pigs than all farms.
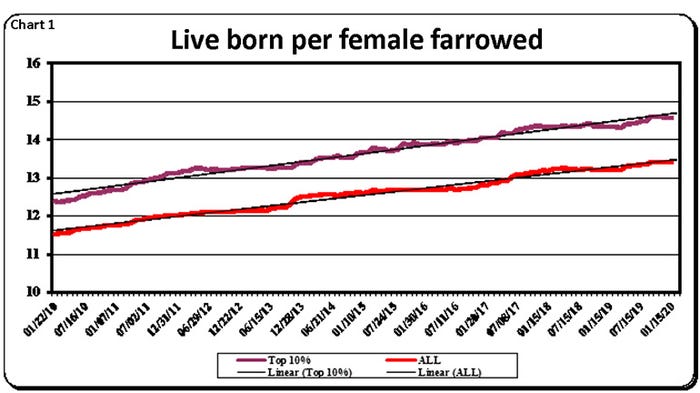
Chart 2 looks at the change in pigs weaned per female farrowed from 2010 to 2020. Weaned pigs have gone from 10.1 to 11.3 for all farms, and 11.1 to 12.8 for the top 10% farms. That is an extra 1.2 pigs, or 11.9%, increase for all farms and an increase of 1.7 pigs (15.3%) for the top 10% farms. Why were there an extra 0.50 pigs or 3.4% larger increase in the top 10% farms? What are these farms doing to save more of the extra pigs being born? Is this related to having improved Day 1 pig care, extending hours someone is attending farrowing or split suckling more litters?
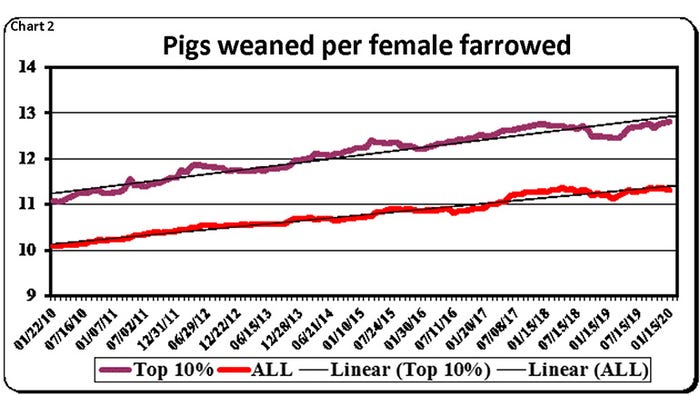
Chart 3 looks at pre-weaning mortality for last the 10 years. The all farms trend line has shown a steady increase in pre-weaning mortality from 12.9% to 14.9%. The trend line for the top 10% is flat at 10.6% for the last 10 years, which is the main reason they show a 3.4% larger increase in pigs weaned per female farrowed.
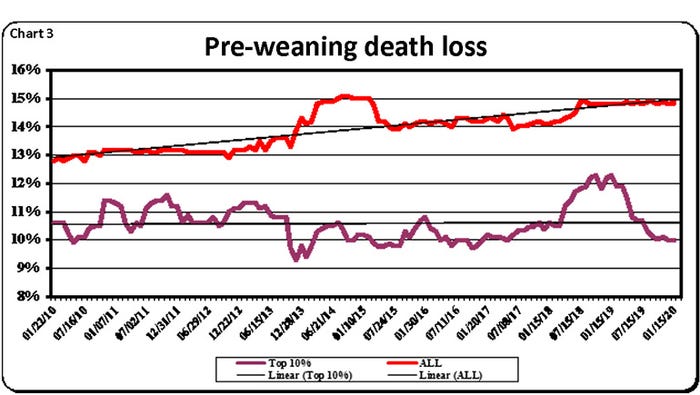
Table 1 displays SMS production numbers breaks the farms out by percentages: 90-100, 70-90, 50-70, 0-30, All (52 weeks), and last 13 weeks, 26 weeks and last 12 quarters based on pigs weaned per mated female per year. Pigs weaned range from 12.77 for the 90-100 percentile to 10.29 for the 0-30 percentile, that is a 24.1% difference. Pre-weaning mortality ranges from 9.9% for the 90-100 percentile and 18.5 for 0-30 percentile, or an 86.9% difference. Some of the farms that make up these numbers may have been affected by disease issues over the last year. We did not remove farms that have dealt with health issues.
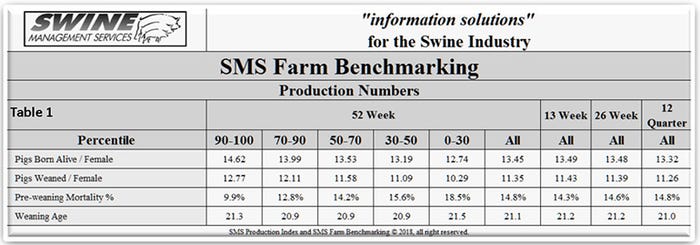
Table 2 shows SMS production numbers broke out by parity starting with Parity 0 to Parity 7-plus females which are averages of all the genetic variation in the data set. Over the last 11 years we have written 168 columns. Several have focused on how Parity 0/Parity 1 performance dictates how the female will perform over their lifetime. The 90-100 farms average 13.05 pigs weaned per female farrowed, the 70-90 average 12.54, 50-70 average 11.98, 30-50 average 11.36 and 0-30 average 10.58. There were 2.47 pigs, or 23.3%, weaned difference. The top 10% farms have learned how to develop the gilts properly and wean larger litters and wean more pigs over the lifetime of the female on the farm.

Through our SMS Farm Analysis program and consulting we try to answer the first two questions. How to cause the change will be up to the farm management and staff. The top 10% have adapted and changed to handling the larger weaned litters. What is your farm doing to get more of the potential from your genetic choice? If you can wean more pigs per litter, you can lower your production cost per pig produced. What are you doing to increase live born and wean more of those extra pigs?
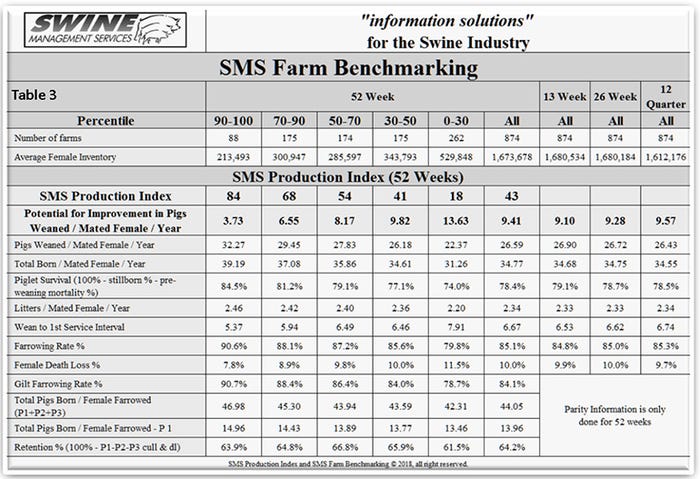
Table 3 provides the 52-week rolling averages for 11 production numbers represented in the SMS Production Index. The numbers are separated by 90-100%, the 70-90%, the 50-70%, the 30-50% and the 0-30% groups. We also include the 13-week, 26-week and 12-quarter averages. These numbers represent what we feel are the key production numbers to look at to evaluate the farm's performance.
At SMS, our mission statement is to provide "Information solutions for the swine industry." We feel with the creation of different SMS Benchmarking databases for all production areas we now have more detailed information to share with the swine industry. If your farm would like to be part of the SMS Benchmarking databases or if you have suggestions on production areas for us to write columns about, contact Mark Rix or Ron Ketchem. We enjoy being a part of the National Hog Farmer NHF Daily team. Previous columns can be found at NationalHogFarmer.com.
Sources: Ron Ketchem and Mark Rix, who are solely responsible for the information provided, and wholly own the information. Informa Business Media and all its subsidiaries are not responsible for any of the content contained in this information asset.
About the Author(s)
You May Also Like
