Growth of retail demand has more than offset decline in foodservice demand caused by shutdowns.
January 12, 2021

While 2020 was a disaster on many fronts, one area that didn’t fall into the disaster category was domestic meat and poultry demand. Disruption? Absolutely. But, perhaps surprisingly, the disaster moniker doesn’t apply to this aspect of our business.
That doesn’t’ mean that 2020 wasn’t a wild ride. As can be seen from both Figure 1 and 2, real per capita expenditures for the three largest species and for pork followed a roller coaster path that would make even Cedar Point, Ohio (look it up – it’s heaven if you are a roller coaster fan!) proud.
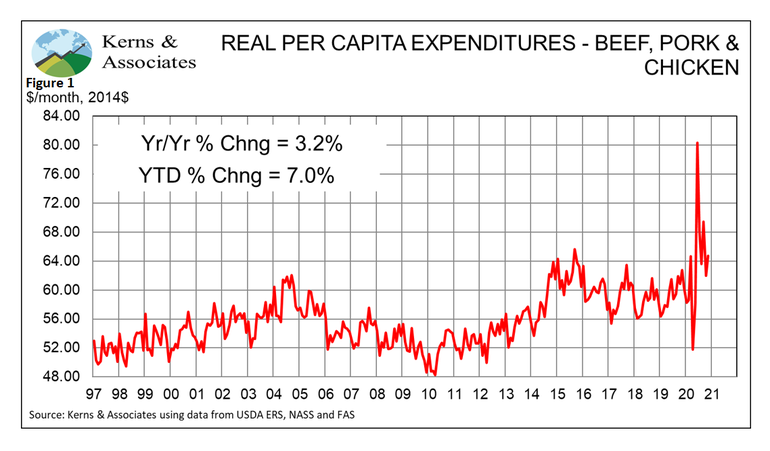
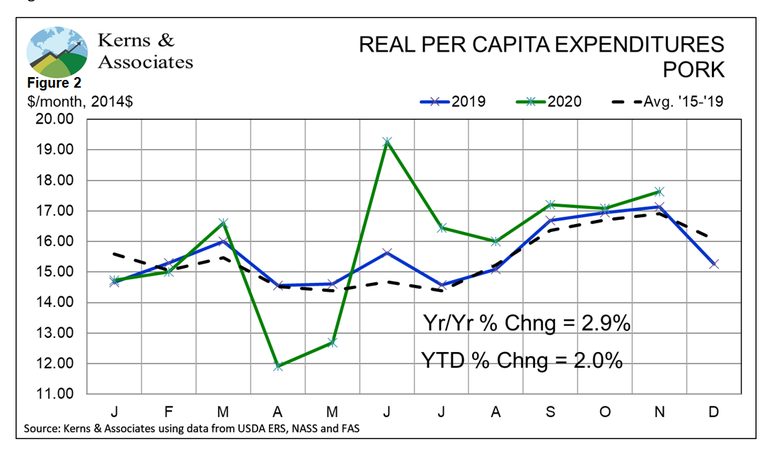
Real per capita expenditures (RPCE) is a measure of the position of a demand function in the traditional Price-Quantity space used in supply and demand diagrams. Higher RPCE means the demand function moves up and to the right (ie. away form the origin) while lower RPCE would indicate a downward and leftward move of the demand function. RPCE is a very close cousin to the demand indexes first used by Professor Glenn Grimes back in the 1980s and is still used by a number of analysts today. I use RPCE primarily because it denominated in dollars instead of a percentage of some base period. Note that the units in these charts are constant 2014 dollars.
The remarkable feature of both charts is that they show year-to-date gains for consumer-level three-species demand and pork demand. That is not just retail demand, which we know has been ultra-strong since foodservice providers were shut down or slowed down last spring. These measures use total per capita consumption of each species and a deflated retail price to characterize demand. They include all product consumed by U.S. consumers and value that product using the deflated retail price.
Some may say “Aha! That can’t be right,” but it is correct, and, even if not, it’s the best we can do since we don’t have any data on the average price that consumers pay for meat products through foodservice channels. The price that I paid for the sausage component of my favorite sausage and egg biscuit this morning included all kinds of services, including cooking and packaging. The price you paid for that steak last week included the building, the cook staff, silverware, a plate, etc. You can see how difficult breaking out the meat portion would be, even if someone tried.
So, the only alternative is to use USDA’s retail price to value all of the meat consumed in the U.S. Now, the USDA price data are not perfect, but they are about all that is publicly available, and they are generally consistent over time. Further, using them to value product going through resturants is reasonable. If foodservice usage increases, the supply of product available to retail consumers will be reduced, thus driving up the price that retail outlets can charge so the retail price will change if foodservice demand changes. It’s not perfect, but, as I stated, it is reasonable and about all we have available.
So how did this happen? I think we need to remember that people are still going to eat, even if they can’t find a restaurant to eat in or to order from. That is what we witnessed in 2020, and the data say that growth of retail demand has more than offset the decline in demand caused by shutdowns of the foodservice sector. I thought from the beginning that the trade-off would be close. I never expected retail gains to be this strong, however.
And now we must ask what this means for the future. I don’t think anyone knows. Will consumers who have prepared more meals at home during our COVID trials continue to do so? Have we given rise to a new generation of Julias and Emerils that will keep the trend going? Or will everyone flock back to restaurants as soon as they are safe? Will there be any restaurants to flock back to? All good questions that command our attention in 2021 and beyond.
The other major component of U.S. pork demand, exports, performed remarkably well in 2020, as well. November’s increase actually puts us over the top to set a new annual record with the 11-month total already surpassing 2019’s record level. Whatever happened in December will be gravy for a remarkable year!
Figure 3 shows monthly and year-to-date data by country. November shipments were larger, month-on-month, to China/Hong Kong, Mexico and Korea and were just fractionally lower for Japan and Canada.
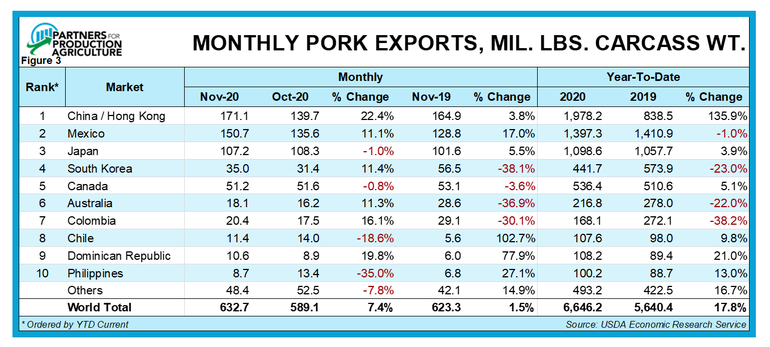
Relative to November 2019, shipments were larger for China/Hong Kong, Mexico, and Japan. Total U.S. exports in November were 7.4% larger than last year and bring the 2020 total to 6.646 billion pounds (carcass weight equivalent), which is 17.8% larger than one year ago. Monthly data for the U.S. and major export markets appear in Figures 4 and 5.
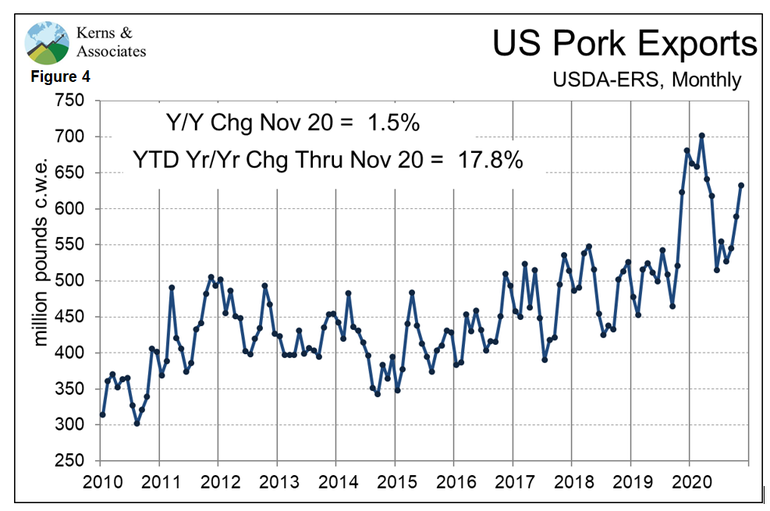
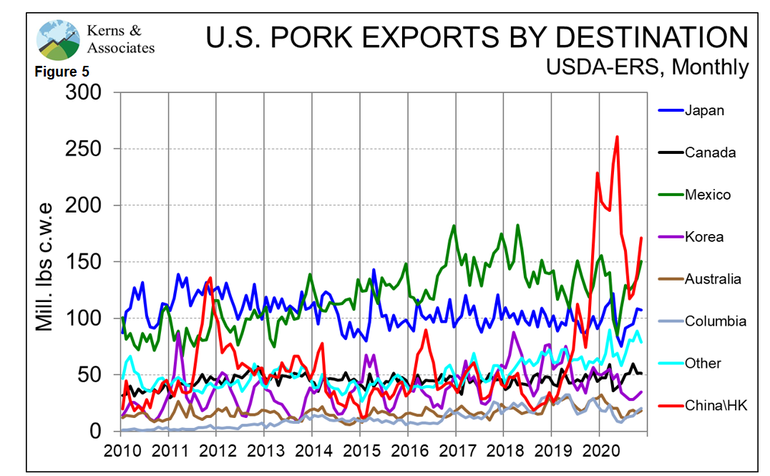
Most analysts believe the U.S. pork sector will be hard pressed to match 2020 export performance in the coming year. The primary reason will be lower shipments to China/Hong Kong as China’s industry continues its recovery from African swine fever. We do not expect a large decline, however, since China will still likely face difficulties getting pigs to live to market age/weight and U.S. product will be priced with a lower-valued U.S. dollar.
Happy 2021!
Sources: Steve Meyer, is solely responsible for the information provided, and wholly owns the information. Informa Business Media and all its subsidiaries are not responsible for any of the content contained in this information asset.
About the Author(s)
You May Also Like


