Understanding vehicle movement patterns and trends can help identification of potentially risky behaviors.
January 11, 2021
Social connections do not happen randomly; people tend to interact with family, friends, coworkers, neighbors, or those who share similar hobbies and interests. The current COVID-19 pandemic has given us a firsthand understanding of the risk of viral spread when an interaction between an infected and a susceptible individual occurs without proper preventive measures such as facemasks and distancing.
Similarly, animal connections occur in the swine industry and are influenced by production cycles and companies' structures as part of genetic improvement, age segregation, and an increase in production efficiency. While animal movements (e.g. connections) aim for better health and specialized care, these pig movements depend on the use of trucks and trailers, highlighting the importance of good biosecurity practices (e.g. turck-trailer cleaning-and-disinfection, lines of separation) to control and/or prevent disease transmission among animals moved (similar to facemasks).
Considering that a better explanation for the infectious disease spread phenomenon in the swine industry can be achieved by the assessment of the connections among sites, our Morrison Swine Health Monitoring Project (MSHMP) team, in collaboration with a participating system, is working on the understanding of vehicle movement patterns and trends that can guide us towards the identification of potentially risky behaviors (e.g. biosecurity compliance) that can result in a higher risk for infectious disease spread.
To do this, tracking devices have been installed on seven truck-trailers (the truck was always hauling the same trailer) and five trailers, providing consistent movement data on vehicle trajectories. When vehicles entered a predetermined area (e.g. landmark), a signal was captured recording the location and time spent in that area. These landmarks included sow, gilt development unit (GDU), nursery, wean-to-finish, finisher farms and truck-wash facilities.
While this project is ongoing, the first step to gaining value was to describe typical route circuits that can indicate the connectivity within the system.
A primary analysis of approximately 5,000 trips recorded between January 2019 and June 2020 (3,659 and 1,093 in 2019 and 2020, respectively) between 101 sites showed interesting trends. We observed that the seven trucks completed 79% of the trips and the rest (21%) were completed by the five trailers. The proportion of trips was equivalent among seasons (~25% each season) and between years, with most of the trips made to sow farms (39.7%) and truck-wash facilities (31.2%). The overall time spent at the landmarks was on average 28 minutes (when we exclude those vehicles parked for more than 24 hours in the same landmark). Interestingly, the lowest time spend was at the wean-to-finish and finisher farms (22 mins.), and the time spent at the truck-wash was the longest observed, with the median time of washing and drying reaching 2 hours. Overall, this represents enough time for the performance of a proper cleaning/disinfection/baking practice at the truck-wash.
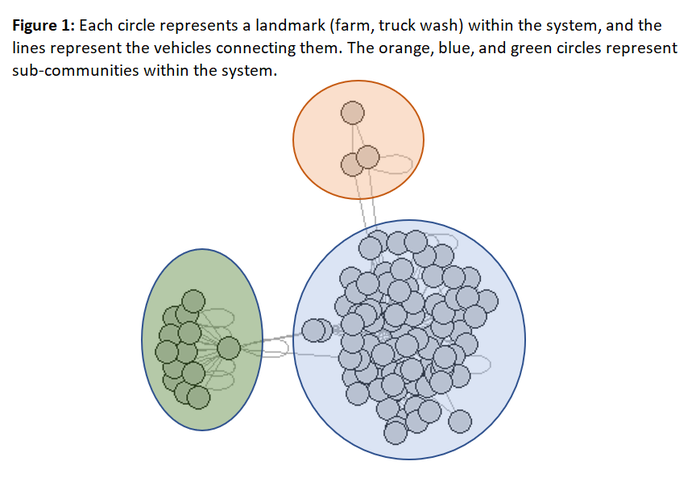
Not surprisingly, preliminary network analysis showed a high interconnected production system. Every farm in the system can be reached through three farms. In other words, farms are three stops away from each other. This is extremely important as it increases the potential for pathogen dissemination through pig flow, or if biosecurity measures such as cleaning and disinfection are not properly performed. Furthermore, we identified three “communities” (Fig. 1) where farm connectivity is stronger between the farms within a community than those in the other two communities. In the case of disease spread, this can be an invaluable piece of knowledge, because it allows the production system to purposefully segregate these communities from each other and reduce or prevent disease spread should an emergency occur. Essentially, it allows for a system-level “physical distancing” within the production system as part of the system’s biosecurity program.
Further analysis needs to be conducted to understand these connections in more detail. However, it is clear that connectivity is not random within the system and some movements (e.g. vehicles connecting communities) can be targeted when a disease outbreak occurs to reduce the risk of transmission throughout the whole system.
Capturing transport data in real-time, and with a high degree of reliability, is possible and can provide important information that helps in the understanding of system-wide connectivity to comprehend trucking efficiency. Analysis of this data can ultimately help us to recognize potential behaviors that can help or hinder the spread of diseases, impact animal welfare, and allow a producer to better manage movements and biosecurity during a disease outbreak.
Sources: Catalina Picasso Risso, Mariana Kikuti, Cesar A Corzo, and Morrison Swine Health Monitoring Project , are solely responsible for the information provided, and wholly own the information. Informa Business Media and all its subsidiaries are not responsible for any of the content contained in this information asset.
You May Also Like
