Subscribe to Our Newsletters
National Hog Farmer is the source for hog production, management and market news
Development of the gilt is important in growing a productive farrowing operation, but maybe the most important number is pigs that are weaned per female per year.
May 9, 2016

Swine Management Services passed a milestone last week. We added our 1,000th farm and 1.8 millionth female (1.7 million mated females) to our SMS Benchmarking Database. There are farms from the United States, Canada, China and the Philippines in the database. We want to thank all the producers who helped us reach this milestone. There are 100 farms (128,000 females) we filter out for multiple reasons, bad data, parity segregation, depop/repop, expansions, startups, etc. Each year we drop out farms that have not participated recently.
With reaching this milestone we thought we would take a look at the trends we have seen in the last 11-plus years.
Chart 1 shows the growth in the number of farms from 150 farms in January 2005 to 900-plus active farms in April 2016. The dip in October of 2013 is when we introduced our latest version that added parity benchmarking and it took several months to get all the farms converted. Adding parity benchmarking gave us a new insight into what the key drivers are.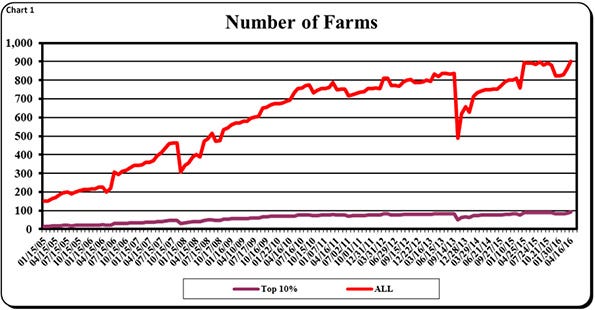
This is our 120th column and we have learned many things by writing these columns and digging into data about what are the key drivers for a farm to produce 30 pigs weaned per mated female per year.
The first key driver is gilt development. If the gilts do not perform well, the farm will not be a top performing farm. Last month we wrote about gilts being your future, gilt (P1) farrowing rate and gilt (P1) total born per female farrowed are keys to your future.
We still rank the farms by pigs weaned per mated female per year, but the more important numbers to look at are total born per female farrowed and total born per mated female per year.
Chart 2 is Total Born/Female Farrowed. All farms started at 11.57 in 2005 and the top 10% at 12.41, a difference of 0.84 pigs. The top 10% farms have increased to 15.05, 21.3% improvement, and all farms have increased to 14.02, improving at the same rate at 21.2%. We do see the last year total born per female may be leveling off for both the top 10% and all farms.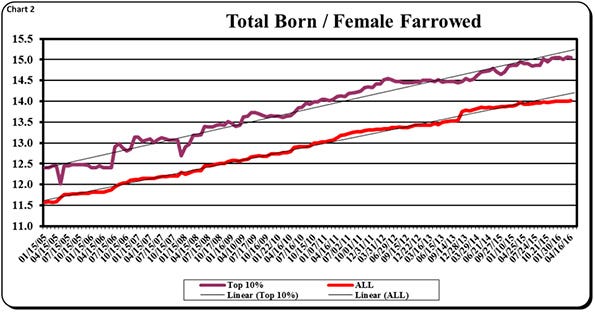
Chart 3 is Total Born/Mated Female/Year. The top 10% have improved from 30.78 to 37.46 or 6.68 pigs (21.7%). The all farms have moved from 27.42 to 32.86 or 5.44 pigs (19.8%). The top 10% have a higher litters per mated female per year (Table 1), 2.49 compared to all the farms at 2.34, a 6.4% difference and a higher farrowing rate — 90.8% compared to 85.1% or a difference of 5.7%.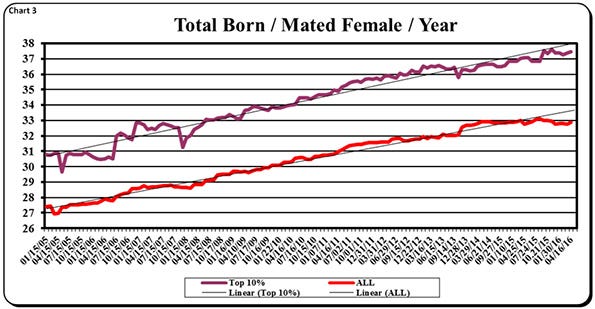
The top 10% have improved from 9.98 pigs weaned per female farrowed (Chart 4) to 12.33 or a gain of 2.35 pigs (23.5%) improvement, while the all farms have improved from 9.00 to 10.88 which was a gain of 1.88 pigs (20.9%) improvement. The improvement can be seen in the difference in piglet survival. The top 10% are at 84.8% and the all farms are at 79.1%. The all farms average is higher in stillborns by 1.5% and pre-weaning mortality by 4.2%.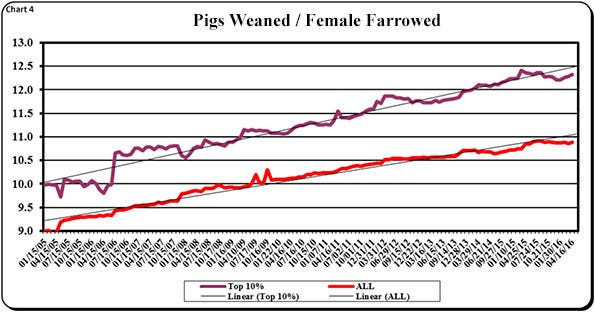
We still rank by pigs weaned per mated female per year, because pigs out the door are still the most important number for a sow unit. The top 10% have improved by 24.5%, from 24.84 to 30.97 pigs for a gain of 6.1 pigs and the all farms have improved from 21.24 to 25.41 pigs which was 4.17 pigs which was a 19.6% improvement.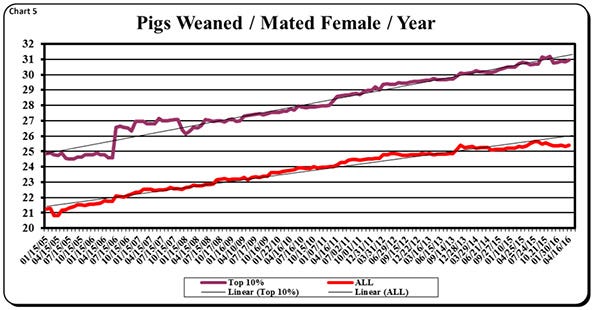
Table 1 has the numbers for 2005 and the first quarter of 2016 which will show you the total improvements that have been made and the percent improvement. Remember these are averages, not the minimum or maximum for each production number.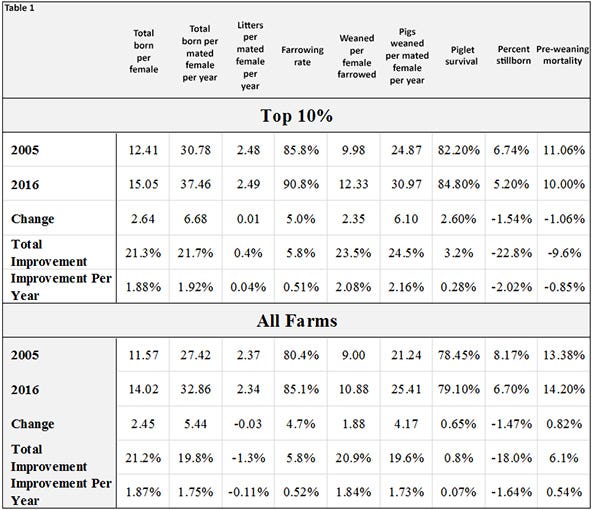
The growth line for pigs weaned per mated female per year has followed the trend line for the last 11 years, but we see the actual falling behind the trend line the last five months. This is true for all the farms and the top 10%. Are the farms now reaching biological limits for some of the production numbers? As you notice in the table the top 10% have been making more improvement over time. We feel these farms are early adopters of management changes that improve key numbers like wean to first service interval, farrowing rate and total born. They are the farms that devoted dollars and labor to gilt development, started full feeding sows in lactation and started having more skilled people in farrowing more hours per day to attend more sows farrowing. By being there when sows are farrowing, pulling more pigs, getting them dried within a few minutes of birth, getting them attached to a nipple and doing split suckling of pigs Day 1 they kept more of those extra pigs alive and later weaned.
Is your farm an all-farm average or in the top 10%? Do you need to step out of the box and make changes to management to move your numbers up?
Table 2 provides the 52-week rolling averages for 11 production numbers represented in the SMS Production Index. The numbers are separated by 90-100%, the 70-90%, the 50-70%, the 30-50% and the 0-30% groups. We also included the 13-week, 26-week and 12-quarter averages. These numbers represent what we feel are the key production numbers to look at to evaluate the farm’s performance.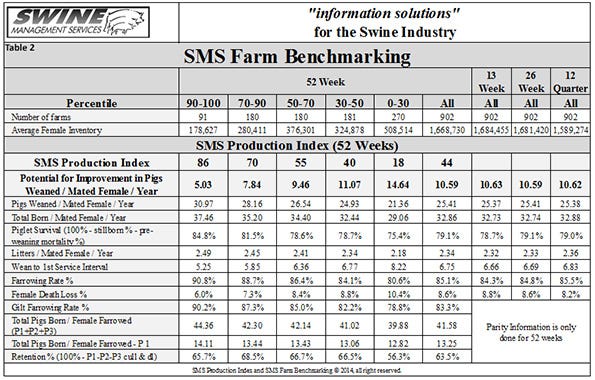
At SMS, our mission statement is to provide “Information solutions for the swine industry.” We feel with the creation of different SMS Benchmarking databases for all production areas we now have more detailed information to share with the swine industry. If your farm would like to be part of the SMS Benchmarking databases, or if you have suggestions on production areas for future column topics, email us at [email protected] or [email protected].
Previous Production Preview columns can be found at NationalHogFarmer.com.
We enjoy being a part of the National Hog Farmer “Weekly Preview” team.
You May Also Like
Enter a zip code to see the weather conditions for a different location.


