Farrowing rates for gilts and sows that recycle are 15 to 20% lower than first-service females. Is your operation losing production by rebreeding these females rather than replacing them?
Gilts and sows that recycle and are rebred on average have a farrowing rate that is usually 15-25% lower than first-service females (weaned sows and first time bred gilts). How many of those can your farm afford to breed again? What is the cost of non-productive days and lower farrowing rate compared to just breeding a gilt to replace them? Should you adjust that number seasonally to make sure you are making your farrowing target in the late-fall and early winter months?
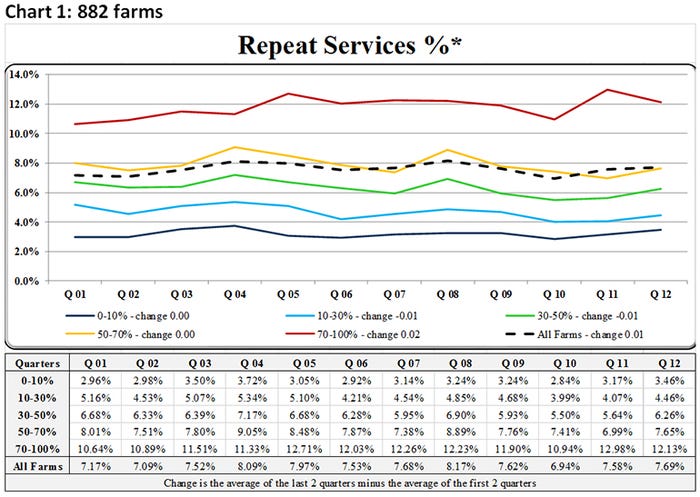
Table 1 (see at the bottom of this column)looks at the 882 farms in the Benchmarking Database and shows the breakdown of farms by percent of repeats. Over the last 12 quarters (three years) there is little difference in the percent of repeats being bred each quarter. Across all groups there are a few more repeats bred in the third quarter of each year (Quarter 1, Quarter 7 and Quarter 11).
In the table in Chart 1, notice that the top 10% farms sorted by pigs weaned per mated female per year have figured out how to improve farrowing rate and production by rebreeding fewer returns with much lower average at 3.47% repeats. There are a large number of these farms that breed no repeats. Once farrowing rate is in the upper 80%, breeding repeats will prevent a farm from moving into the 90+% numbers.
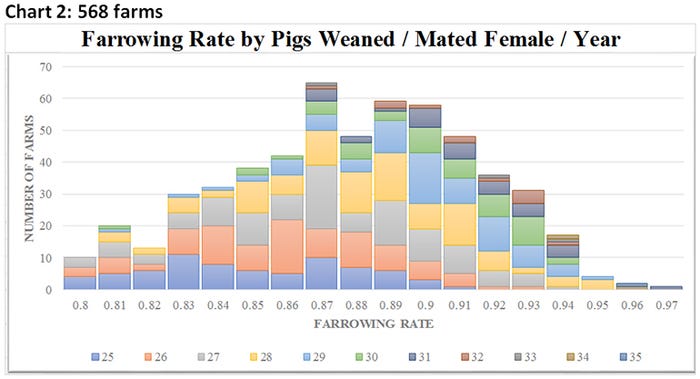
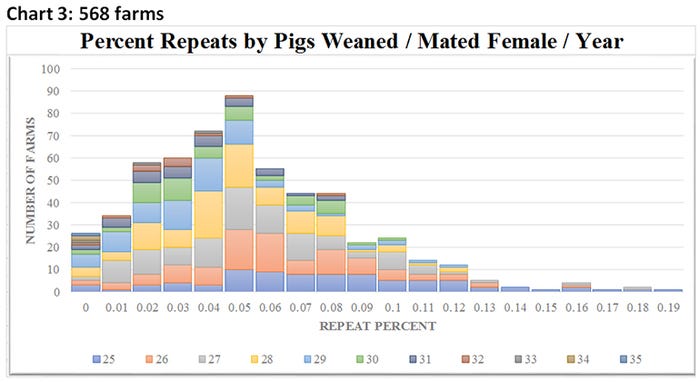
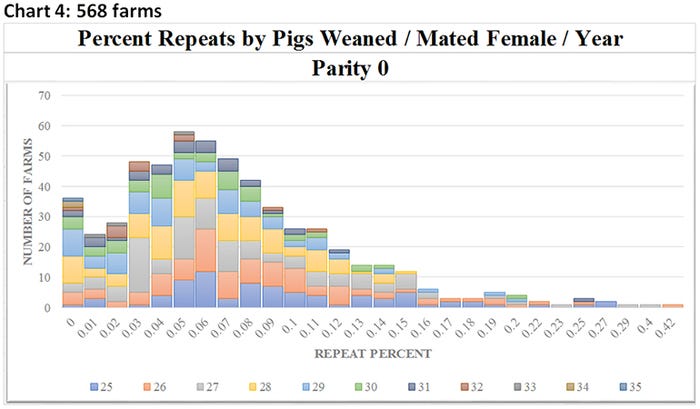
In Charts 2 through 4, we filtered the data down to 568 farms that had a farrowing rate of 80% or better and greater than 25 pigs weaned per mated female per year for the last 52 weeks. Chart 2 shows the number of farms broken out by both pigs weaned per mated female per year and farrowing rate. This chart shows that in general the higher the farrowing rate the higher the pigs weaned per mated female per year. Chart 3 shows the percent of repeats by pigs weaned per mated female per year. This shows a clearer trend — the lower the percent repeats the higher the pigs weaned per mated female per year. In the Chart 3 there are 27 farms that are not rebreeding any returns. At the other end there are farms that rebred up to 19% of the weekly matings. What do you think that does to the overall farrowing rate? Chart 4 shows just the percent of repeats for gilts. There are farms that are rebreeding more than 40% of the gilts. We have seen farms after porcine reproductive and respiratory syndrome breaks that were closed down for five to six month after the break and were not bringing in replacement gilts. These farms had a limited inventory at the start of the break that just kept rebreeding returns to make their weekly breeding target that had weekly farrowing rates as low at 40%. We all know that the first litter sets the sow’s lifetime productivity.
For Charts 5 and 6 we filtered the data further and looked at 50 farms that were at 26.5 pigs weaned per mated female per year for the last 52 weeks. Chart 5 looks at percent of repeats on 972,257 matings going back to January 2013 on a monthly basis. This shows two significant spikes — one in January 2013 that relates to the porcine epidemic diarrhea virus outbreak and the other in April to August of 2015 relating to the semen extender issue.
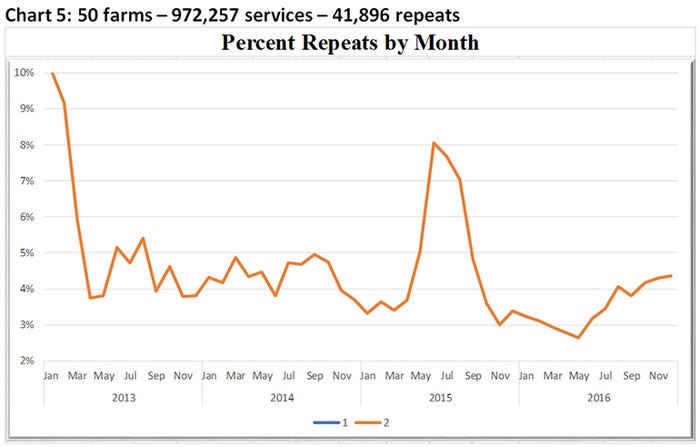
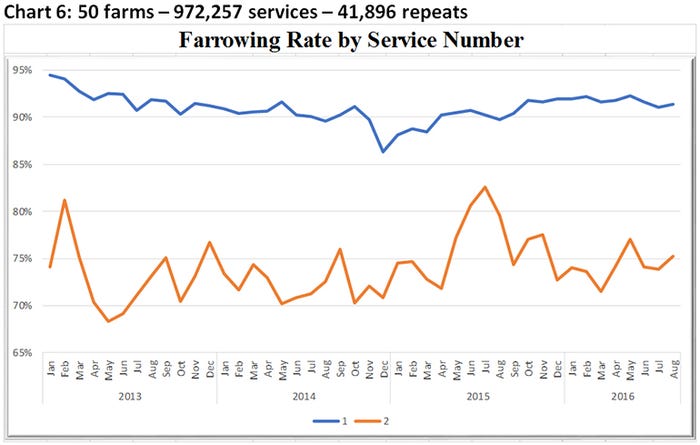
Chart 6 shows the difference in farrowing rate between first-service females and repeats. This chart depicts two key points. One is that repeats are much more unpredictable and variable than first-service females in farrowing rate and total born. The second point is that the performance of repeats does tend to improve slightly during the summer months. This indicates that many of those repeats needed time for their bodies to recover to maintain pregnancy.
How do repeats perform in your operation? Should you be rebreeding any of them? Are you supplying your operation with enough gilts to breed so that they don’t have to breed repeats or at least not too many repeats to meet your breeding target? Is it OK to be short of the target a few animals to get quality matings compared to the quantity of matings? Make sure the breeding team knows what the expectations are and how repeats perform in your herd are important.
SMS 52 week numbers
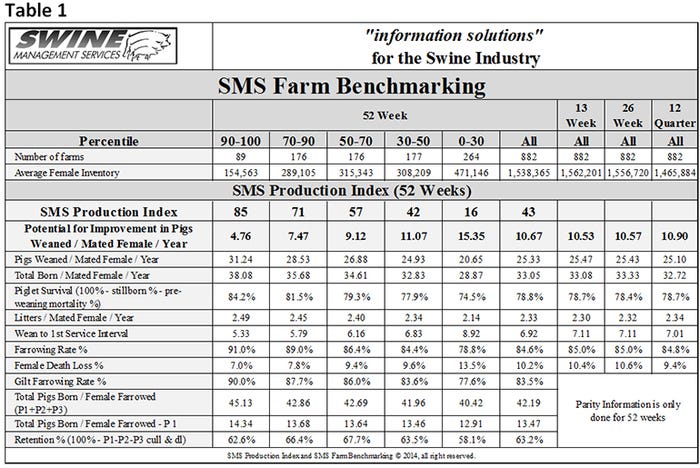
Table 1 provides the 52-week rolling averages for 11 production numbers represented in the SMS Production Index. The numbers are separated by 90-100%, the 70-90%, the 50-70%, the 30-50% and the 0-30% groups. We also included the 13-week, 26-week and 12-quarter averages. These numbers represent what we feel are the key production numbers to look at to evaluate the farm’s performance.
At Swine Management Services, our mission statement is to provide “information solutions for the swine industry.” We feel with the creation of the SMS Benchmarking databases for all production areas we now have more detailed information to share with the swine industry. If your farm would like to be part of the SMS Benchmarking databases or if you have suggestions on production areas to write columns about, email us at [email protected], [email protected] or [email protected].
We enjoy being a part of the National Hog Farmer Weekly Preview team. Previous Production Preview columns can be found at NationalHogFarmer.com.
About the Author(s)
You May Also Like
