Subscribe to Our Newsletters
National Hog Farmer is the source for hog production, management and market news
December 8, 2014

To continue looking at the effect of gestation length on production numbers we will end the year looking to see if wean-to-first service interval is influenced by the previous gestation length of the sow. In the two previous columns: “Gestation Length and Inducing: What do we know?” on Oct. 6 and “Total Born and Stillborn by Parity and Gestation Length” on Nov. 10, we were looking to see the interaction with gestation length and production number.
The data set we used for this column is using 10 sow farms that represent four different genetic companies with 123,921 gestation lengths used. We were not sure what this would show us. Chart 1 and Table 1: Percent of Wean to 1st Service Intervals for All Previous Gestation Length. Chart 1 is set up with wean-to-first service interval on the X-axis with days from one to 17 and on the Y-axis the percent of the sows in heat by day broken out by different gestation length ranging from 110 to 122 days. Table 1 shows wean-to-first service interval broken out by days zero to two, three, four, five, six, seven to nine, 10 to 17, 18 to 25, 26 to 37 and 38+ days and by gestation length from 110 to 122 days.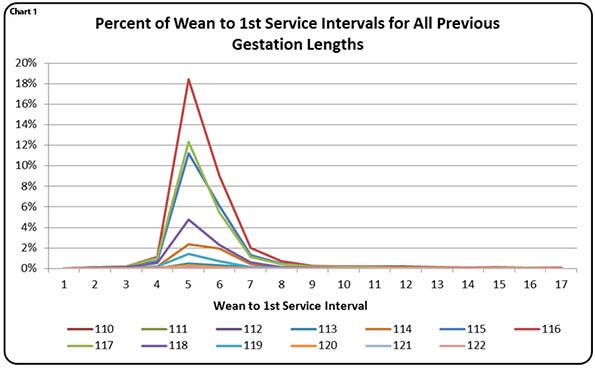
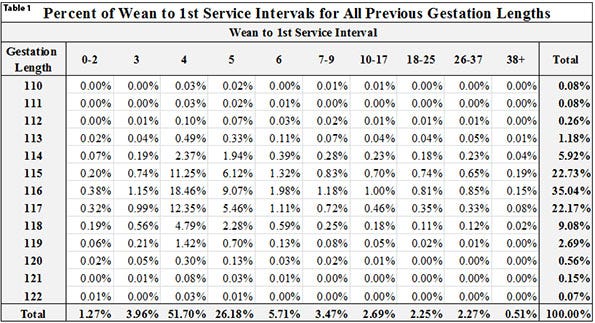 When you look at Chart 1 we were surprised to see sows’ gestation lengths of 115 to 117 days were bred back sooner after weaning with 18.5% of sows bred day four after weaning. We are not sure why the spike at day 116. In Table 1 in the right column under total shows that 35.04% of the sows had gestation length of 116 days, 22.73% at 115 days and 22.17% at 117 days. If we look at the range of 114 to 118 days which is six days, 85.7% of the sows were in that range. The total row at the bottom breaks out the sows by which day they were cycling on after weaning with 1.27% bred on day zero to two, 3.96% bred on day three, 57.1% being bred on day four, 26.18% on day five and 5.71% on day six which is 88.81 bred by day seven. That left 11.19% of the sows bred by day seven-plus.
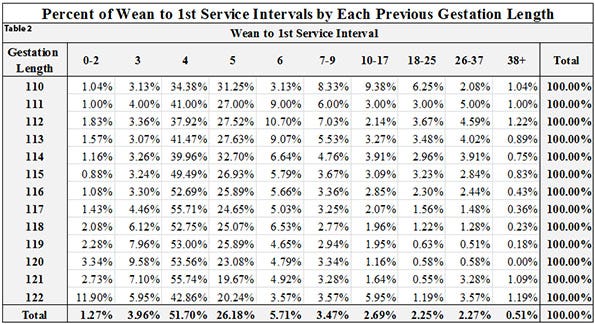
Chart 2 “Percent Bred by Day 6” shows a definite trend line in the longer the previous gestation length was the higher the percentage bred by day six, peaking at 94% on gestation length 119 and 120. In looking at the data there is an increasing number of sows bred day zero to two and day three as previous gestation lengths go up. In Table 2 the data is broken out by wean-to-first-service interval and gestation length.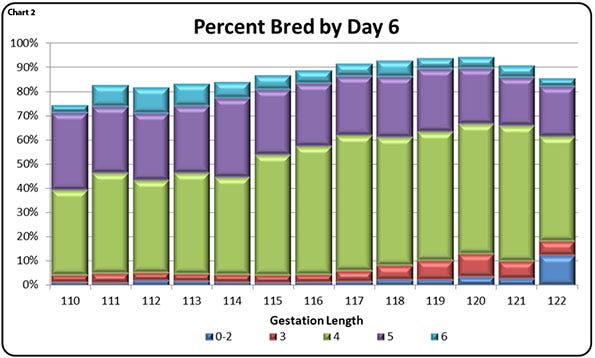
Why did these sows appear to be more fertile as previous gestation length goes up? Was it related to how the sows were fed in gestation, does the farm do bump feeding in late gestation, were the sows full feed in lactation or how much feed sows were given from weaning to breeding or could it be related to genetics?
SMS Production Index
Table 3 provides the 52-week rolling averages for 11 production numbers represented in the Swine Management Services (SMS) Production Index. The numbers are separated by 90 to 100%, the 70 to 90%, the 50 to 70%, the 30 to 50% and the zero to30% groups. We also included the 13-week, 26-week and 12-quarter averages. These numbers represent what we feel are the key production numbers to look at to evaluate the farm’s performance.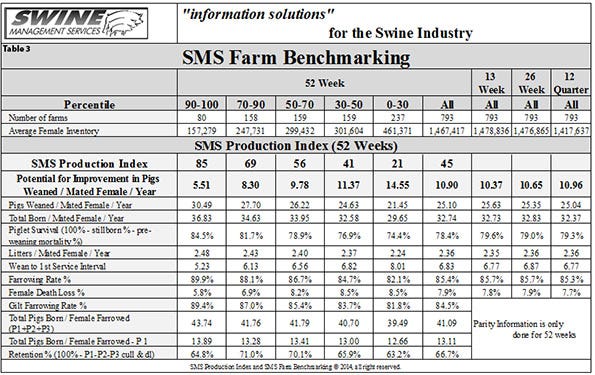
As we end the year 2014 we thank our readers for their support and ideas that they have sent to us at SMS. We have enjoyed looking into the database and see what the data can tell us. Since we updated the Farm Benchmarking report in 2013 we have been updating the Farm Information sheet for all the farms in the data set. If your farm is part of the Farm Benchmarking through SMS or a genetic company that is part of the data set, we need for you to take a look at Page 9 of the most recent report and review the Farm Information sheet. If there are corrections or additions, please update and fax to SMS at (402) 727-7270 or scan in and send to Mark or me. If we get the farms in the data set updated we plan to look more at the farrowing area of farms at size of farrowing crate, floor type under the sow and pigs, number of sows per employee, type of sow housing, etc. Also please keep sending up topics you would like for us to review in future columns. Thank you for your support and have a happy and safe holiday season.
At SMS, our mission statement is to provide “Information solutions for the swine industry”. We feel with the creation of the new Farm Benchmarking database we now have more detailed information to share with the swine industry. If your farm would like to be part of the Farm Benchmarking database, or if you have suggestions on production areas to write columns about, please email or call us. We enjoy being a part of the National Hog Farmer Weekly Preview team.
Previous Production Preview columns can be found at www.nationalhogfarmer.com.
If you have questions or comments about these columns, or if you have a specific performance measurement that you would like us to write about, please contact [email protected] or [email protected].
You May Also Like
Enter a zip code to see the weather conditions for a different location.


