Subscribe to Our Newsletters
National Hog Farmer is the source for hog production, management and market news
June 8, 2015

It is time for a short “soap box” speech. We finished up the first quarter update to the Swine Management Services Farm Benchmarking in the last two weeks. It continues to amaze us the number of farms that do not enter their sow records timely.
There were farms that we had to wait on in May for them to update their data through the end of March which was the end of the first quarter. With breeding performance being the key driver to the farm’s future performance, it is critical that you know the number of females mated to make sure your farm is making its weekly breeding target, the percent of multiple matings (Chart 1), the percent of repeat services that were rebred (Chart 2) and the wean to first service interval (Chart 3) which affects the number of weaned females that are going to be bred that week. You cannot let a problem in this breeding area go on for weeks before you discover there were problems.
We feel it is important to enter sow records weekly with corrections fixed by the end of the week before the farm starts moving animals around in the farm getting ready for the next week to start. This would allow for the sow that was weaned and bred to have her ear tag number corrected before moving somewhere else in the gestation barn. So that weekly farrowing rates can be calculated the farm should be entering sows farrowed that week right after they farrow versus waiting three to four weeks until the sows get weaned.
When we do more detailed analysis on farms we always run an Open sow list, Action list or Inactive Female list to see how clean the farm data is. If a 2,500-sow farm has an extra 200 sows on the action lists that are inactive but still on the list, and the farm weaned 65,000 pigs the last 52 weeks, pigs weaned per mated female was at 26.0 pigs. But if the 200 “ghost” sows are added which increases mated female inventory to 2,700 sows, the pigs weaned per mated female drops to 24.07 pigs. How many farms have an extra 100 to 400 ghost sows on the action lists?
For the data charts there are 790 farms and 1,254,696 mated females chosen for this article. There are 41 farms over 30 pigs weaned per mated female per year and 45 farms under 20 pigs weaned per mated female per year.
In Chart 1, Percent Multiple Matings versus PW/MF/YR, the chart is laid out with 790 individual farms on the X-axis and PW/MR/YR on the left Y-axis and percent multiple matings on the right Y-axis. The blue trend line: Pigs Weaned per Mated Female per Year (PW/MF/YR) start on the left side at 15 pigs going up to 33+. You will see as the percent multiple matings increases so does the PW/ MF/YR. When we are doing more detailed analysis of farms we see that a high percent of the single matings are P0 females.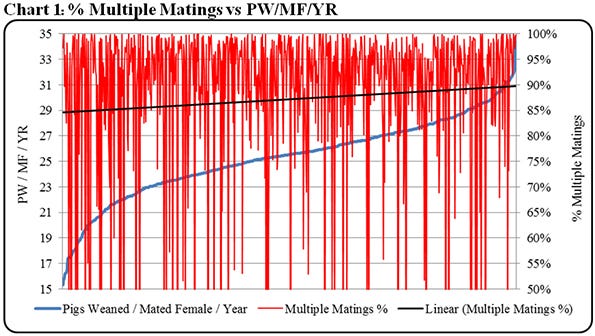 Chart 2, Percent Repeat Services versus PW/MF/YR, is laid out like Chart 1 with the right Y-axis being percent repeat services. As you see the blue trend line, PW/MF/YR you see some farms up to 33+% repeats with the top farms at less than 5% all the way to 0% repeats, which means there is an increasing number of sow farms that are not rebreeding any repeat females. Remember that for each 4% improvement in farrowing rate, pigs per mated female per year go up by 1.35 pigs.
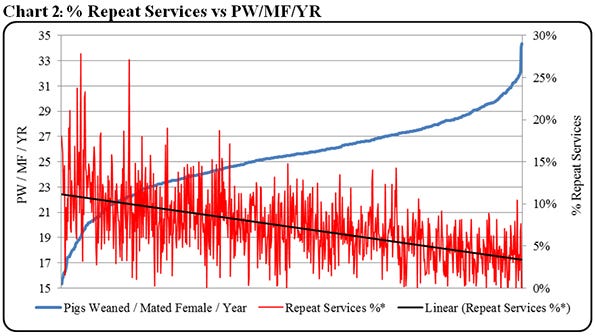
In Chart 3, Weaned to First Service Interval versus PW/MFYR, again laid out like Chart 1 and 2 with the right Y-axis being wean to first service interval. The blue trend line – PW/ME/YR – shows as wean to first service days drop, PW/MF/YR increase with farms below five days at 25+ pigs.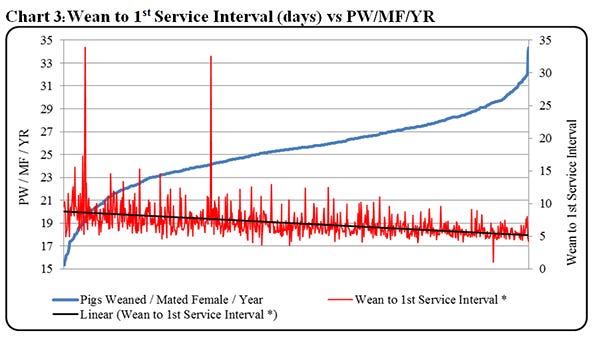
In summary are your records current or do you wait until sows are weaned to enter current data. Are corrections that need to be made done timely especially before sows are moved at the end of the week? If records are current and accurate they are a valuable tool to improving farm performance. The three charts we have included in the article show that farms that keep multiple mating high, reduce repeat services by improving breeding procedures and how farms that are feeding sows aggressive in farrowing to lower wean to first service interval has improved the number of pigs weaned per mated female per year.
Table 1 provides the 52-week rolling averages for 11 production numbers represented in the SMS Production Index. The numbers are separated by 90-100%, the 70-90%, the 50-70%, the 30-50% and the 0-30% groups. We also included the 13-week, 26-week and 12-quarter averages. These numbers represent what we feel are the key production numbers to look at to evaluate the farm’s performance.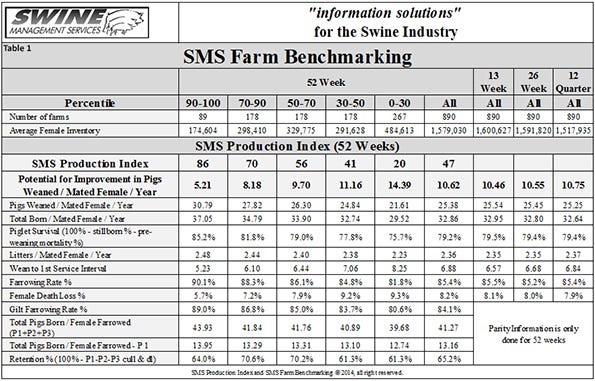 At SMS, our mission statement is to provide “Information solutions for the swine industry.” We feel with the creation of different SMS Benchmarking databases for all production areas we now have more detailed information to share with the swine industry. We enjoy being a part of the National Hog Farmer “Weekly Preview” team. Previous Production Preview columns can be found at www.NationalHogFarmer.com.
If your farm would like to be part of the SMS Benchmarking databases, or if you have suggestions on production areas to write articles about, please email or call us. If you have questions or comments about these columns, or if you have a specific performance measurement that you would like us to write about, please contact [email protected] or [email protected].
You May Also Like
Enter a zip code to see the weather conditions for a different location.