Subscribe to Our Newsletters
National Hog Farmer is the source for hog production, management and market news
The demand for larger groups of weaned pigs to go into larger finisher sites and buildings appears to be one of the drivers for producers going toward batch farrowing.
October 10, 2016

Last month we revisited batch farrowing which continues to grow in numbers in the Swine Management Services data base from 13 farms in the column written Sept. 6, 2011, to 91 for the column last month (Table 3).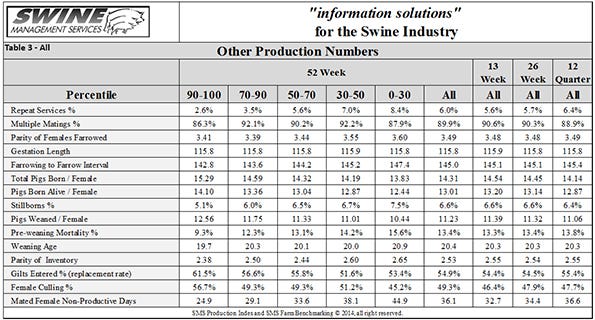
Why the large increase? We feel it is the demand for larger groups of weaned pigs to go into larger finisher sites and buildings. To deal with some of the health issues more producers want to empty a nursery, finisher or wean-to-finish site completely of all animals before cleaning and repopulating. Some producers are tired of mixing pigs’ sources to be able to fill the larger finisher sites that are available. With pig source farms having different health statuses it is becoming evening more difficult to mix sources of pigs.
If you do not know some of the batch farrowing options we have included Table 1 Batch Farrowing Production Summary. I was involved with putting some of these together back in the 1970s when hog producers wanted to get more organized farrowing pigs going from once or twice per year farrowing in A huts outside to more modern farrowing houses and nurseries. To get more return for their investment they wanted to farrow more times per year. As you see in Table 1, there are batch farrowings that use the facilities 13 times per year just like the weekly systems such as the 10/2 (1 weeks breed) and 5/4 (1 weeks breed). Today most of the batches are 5/4 (five batches of sows farrowing every four weeks) or 10/2 (10 batches of sows farrowing every two weeks). With either one of these, the average weaning age is about 18-19 days with a range of 15-22).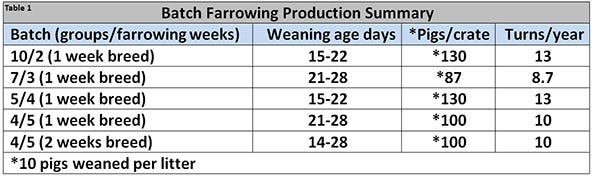
So producers wanting bigger pigs are going to 4/5 (four batches of sows farrowing every five weeks), that moves the pigs weaning age up to a range of 21-28 days with the average at 25. However, the turns per farrowing crate drop from 13 to 10 per year. That adds additional cost to every pig with higher facility cost and more feed to the sows in lactation.
What are some of the negatives of batch farrowing?
♦ Higher risk of lower production if something happens at breeding or farrowing time since several weeks of sows are breeding or farrowing together.
♦ Increased labor demands for two weeks out of every four to five.
♦ Limiting breeding period to less than one week.
♦ More sows to farrowing in a few days.
♦ No nurse sows to place extra pigs at farrowing on or fallback pigs.
♦ Problem with what to do with females that return to heat.
♦ More difficult to add replacement gilts to each batch.
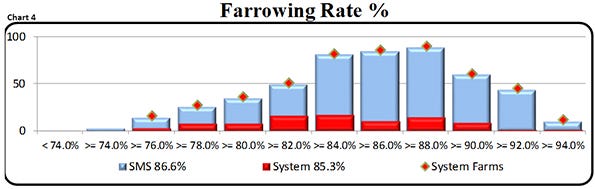
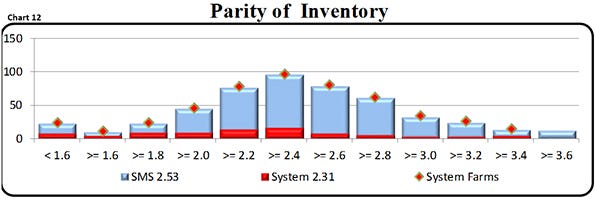
Last month we looked at the data Tables 2 and 3 which were all farms (500) with weekly farrowings and Tables 4 and 5 which were batch. For this column we had added Charts 1-12 which show the large amount of variation in performance for several production numbers. The charts are set up with number of farms on the Y-axis and production numbers on the X-axis. The SMS number is the average for the 500 farms that are weekly and the system if the average for the 91 batch farms. The blue represents all the farms and the red at the bottom of some columns are the batch farms. If you look at the SMS and system (batch) averages there is not as much variation as you would have thought for some areas.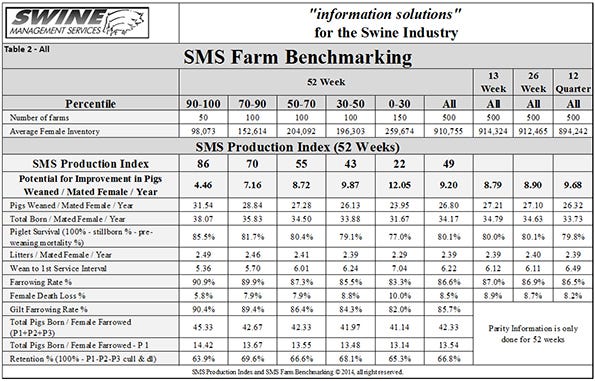
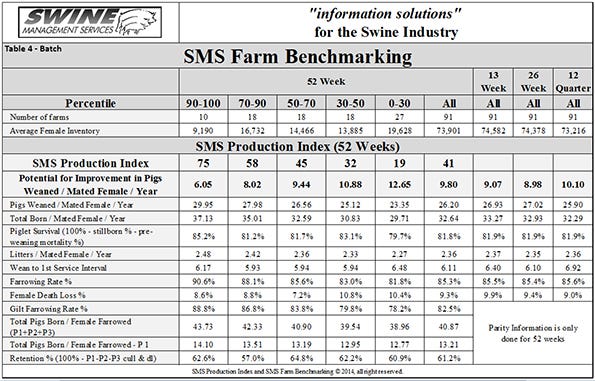
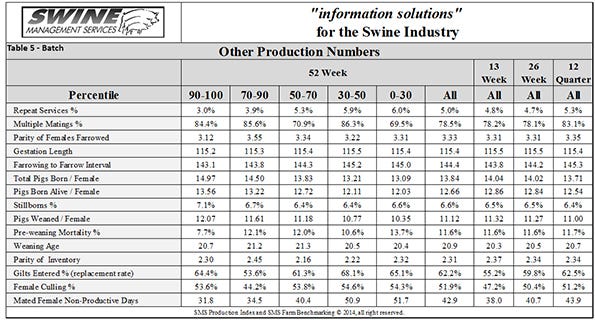
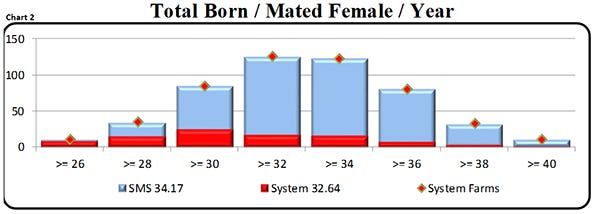
Chart 1 Pigs Weaned/Mated Female/Year shows SMS average at 26.80 pigs with the top 10% at 31.54 pigs versus system (batch) at 26.20 pigs with top 10% at 29.95 pigs. However, both has farms >22 pigs and >31. Chart 2 Total Born/Mated Female/Year showing both with farm with potential of 40-plus pigs with SMS average at 34.17 and system (batch) at 32.64 pigs. Even with batch farms weaning every two, four or five weeks, wean to first service interval days were very close with SMS at 6.22 days and system (batch) at 6.11 days which is shown in Chart 3, Wean to 1st Service Interval Days.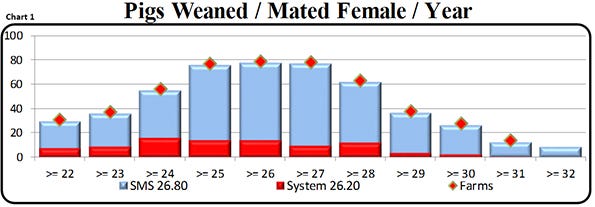
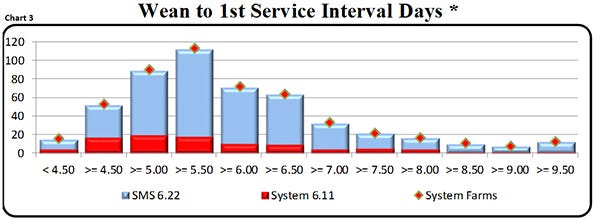
I did look back to the 2011 data and days to cycle were at 6.94 days for SMS and 7.96 days for system (batch). Back in 2011, more weaned sows were skipped to the next batch because they did not cycle in the seven-day window. With changes to how sows are fed in lactation both systems have dropped allowing more weaned sows to be bred by Day 7.
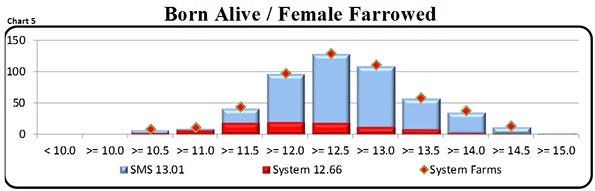
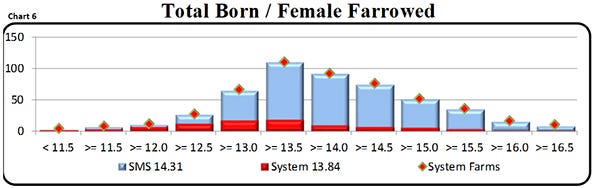
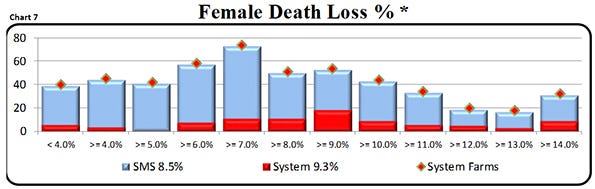
Chart 4 Farrowing Rate % has SMS average at 86.6% versus 11 years ago at 85.2% and system (batch) at 85.3% versus 11 years ago at 84.1%. In Chart 5 Born Alive/Female Farrowed shows SMS at 13.01 pigs and system (batch) at 12.66 pigs with top farms for both at 14.5+ pigs. Chart 6 Total Born/Female Farrowed shows a lot of variation starting with farms <11.5 pigs up to farms at >16.05 pigs. SMS averaged 14.31 and system (batch) at 13.84 pigs. Female Death Loss %, Chart 7, shows average for SMS at 8.5% and system (batch) at 9.3% with a lot of variation from farms for both at a low of <4.0% to several farms at >=14%. We have noticed in the large SMS database an increase in the number of farms with 12-plus% females death loss. Not a good trend line.
For piglet death loss look at Chart 8 Piglet Survival %, Chart 9 Stillborns/Female Farrowed and Chart 10 Pre-weaning Mortality %; piglet survival for SMS was at 80.1% versus system (batch) at 81.8%. Stillborns for SMS at 0.94 pigs and system at 0.91 pigs and pre-weaning mortality percent shows SMS at 13.4% and system (batch) at 11.6%. It appears that the batch systems are making some changes to save more pigs which probably means improved Day 1 pig care and extending hours someone is in farrowing on the heavy farrowing days.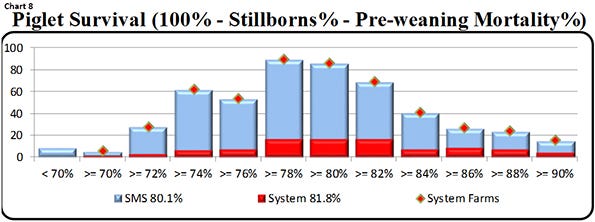
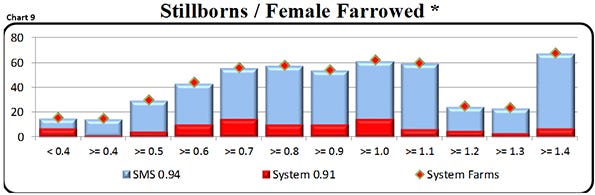
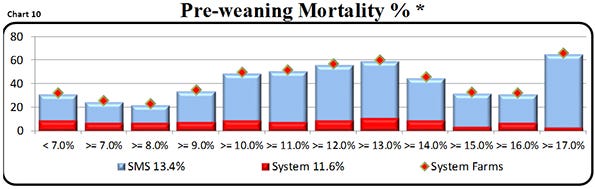
Chart 11, Gilts Entered % (replacement rate), shows system (batch) having a higher number at 62.2% versus SMS at 54.9%. We know that more of the batch systems are culling more of the returns and late-cycling weaned sows to lower open sow days so they have to breed a few more gilts per group. With the help of products that control heat cycles it has become much easier to bring large groups of gilts into the breeding area to help make breeding targets. Chart 12, Parity of Inventory, confirms the higher replacement rate with SMS average at 2.53 litters and system (batch) at 2.31 litters.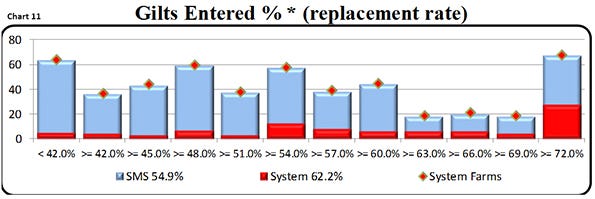
We feel batch farrowing will continue to increase with larger farms on some of the systems that need large groups of pigs turning 2,500- and 5,000-sow farms into batch farrowing. There are a lot of positive reasons to switch to a batch farrowing system. If you are looking at switching to a batch farrowing system it is important that you put a plan together and make sure everyone knows what the new standard operating procedures are and that they follow the plan. We have seen numerous farms take a major step backwards in production for one to two quarters because they did not plan or did not implement their plan properly.
SMS Production Index
Table 6 provides the 52-week rolling averages for 11 production numbers represented in the SMS Production Index. The numbers are separated by 90-100%, the 70-90%, the 50-70%, the 30-50% and the 0-30% groups. We also included the 13-week, 26-week and 12-quarter averages. These numbers represent what we feel are the key production numbers to look at to evaluate the farm’s performance.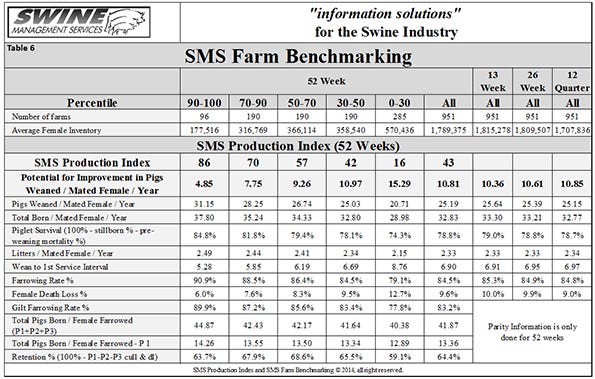
At SMS, our mission statement is to provide ��“Information solutions for the swine industry”. We feel with the creation of different SMS Benchmarking databases for all production areas we now have more detailed information to share with the swine industry. If your farm would like to be part of the SMS Benchmarking databases, or if you have suggestions on production areas to write columns about, contact us at [email protected] or [email protected]. We enjoy being a part of the National Hog Farmer Weekly Preview team. Previous Production Preview columns can be found at NationalHogFarmer.com.
You May Also Like
Enter a zip code to see the weather conditions for a different location.


