Subscribe to Our Newsletters
National Hog Farmer is the source for hog production, management and market news
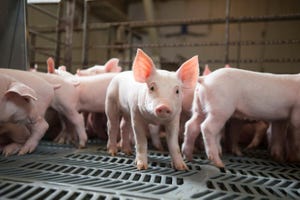
UPDATE: Batch farrowing fills the want of larger numbers of pigs allowing for filling a single nursery, finisher or wean-to-finish site within a few days with similar-aged pigs so the site can be operated all in-all out. This helps to improve overall health of the pigs, reducing exposure of the site to multiple sources of pigs.
September 12, 2016

For the column for this month we decided to go back and look at batch farrowing, we had previously written two columns in September 2011 (How batch farrowing impacts production, Sept. 6, 2011, and An in-depth look at batch farrowing, Sept. 12, 2011).
The data table for those columns had only 13 farms that were batching with range in size of 250 to 1,600 sows. Pigs weaned per mated female per year for batch farms was 24.89 pigs versus Swine Management Services at 24.48 pigs. Farrowing rate was 84.1% versus SMS at 85.2% and total born per female farrowed had batch farms at 13.93 and SMS at 13.26 pigs.
To follow up on the number in 2014 we wrote a column what was published April 7, “Should you consider batch farrowing?” In that column, the batch farms had grown to 40 farms with a range of 237 to 1,655 females with 12 of the 40 farms at 1,000-plus females. The 52-week average for pigs weaned per mated females per year for SMS was at 25.95 with the Top 10% at 30.12 pigs versus batch farms average of 26.34 pigs with Top 10% at 30.12 pigs. The data table showed farrowing rate for SMS at 86.4% with the top 10% at 91.2% and batch at 86.2% with Top 10% at 90.4% and total born per female farrowed for SMS at 13.90 with batch farms at 14.12 pigs.
Why has the number of farms batch farrowing been going up? It goes back to wanting larger numbers of pigs that will allow for filling a single nursery, finisher or wean-to-finish site within a few days with similar-aged pigs so the site can be operated all in-all out. It also allows for a smaller farm to produce a larger number of pigs that increases the value being able to deliver 1,000-plus pigs at a time.
This helps to improve overall health of the pigs, reducing exposure of the site to multiple sources of pigs and if a health challenge occurs, the emptying of the entire site before refilling. As in the case of the sow farms the usual four to five weeks break in farrowing allows for most diseases to stop, allow for sows to develop immunity to the challenge before the next batch of pigs are born.
For the charts and data tables attached, the farms selected had to be at 22-plus pigs weaned per mated female per year for the last 52 weeks with new startups, repopulations, depopulations and farms with a major diseases pulled out. That left 500 total farms with 867,000 mated females and for batch farm an increase to 91 with a total of 70,400 mated females. Along with the large increase in total batch farms there was also a change in sizes. The range in size of the batch farms went from 241 sows to 2,563 with 22 farms at 1,000-plus sows, and of the 22 farms two were 2,000-plus sows.
At a recent meeting I attended it was mentioned that a large system was switching several large 5,000-plus sows’ farms over to batch farrowing. Just think about a 5,000-sow farm on a four-week batch system. This week we need to breed 1,028-plus females, look at farrowing approximately 874-plus females and weaning 9,616-plus pigs every four weeks. I will need to see one of the farms in the future.
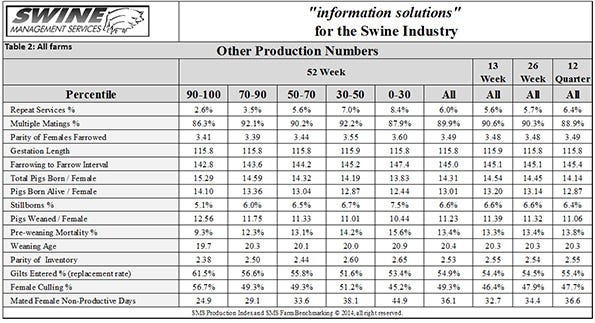
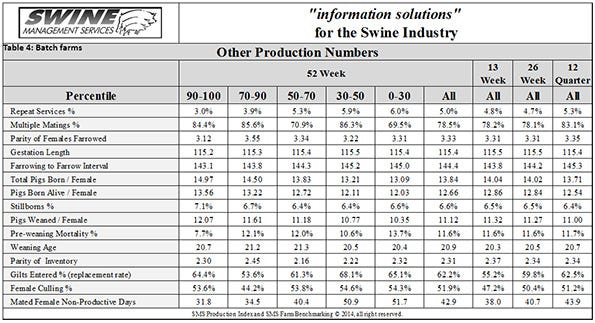
You will find composite data for all farms in Tables 1-2 and the 91 batch farms in Tables 3-4. To highlight some of the key areas: Pigs weaned per mated female per wear has SMS at 26.80 pigs with the Top 10% at 31.54 pigs and the 91 batch farms at 26.20 pigs with the Top 10% at 29.95 pigs. The potential total born per mated female per year with SMS at 34.17 pigs, and the Top 10% at 38.07 versus batch at 32.64 with the Top 10% at 37.13 pigs. Farrowing rate for SMS at 86.6% with Top 10% at 90.9% and batch at 85.3% with Top 10% at 90.6%, Total born per female farrowed average for SMS at 14.31 with Top 10% at 15.29 versus batch average at 13.84 with Top 10% at 14.97 pigs. For pigs weaned per litter weaned SMS average was at 11.15 pigs versus batch at 11.09 pigs.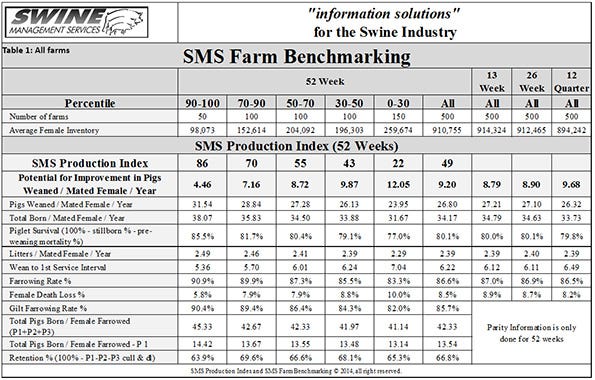
As you see in the tables, there is not a lot of difference in the averages and Top 10% numbers between the all farms and the batch farms. We know with batch farms that are farrowing every four or five weeks do have some very long days in farrowing and breeding for two weeks out of four or five. However, what is the advantage for the pigs downstream which is improved health and the ability to manage sites all in-all out.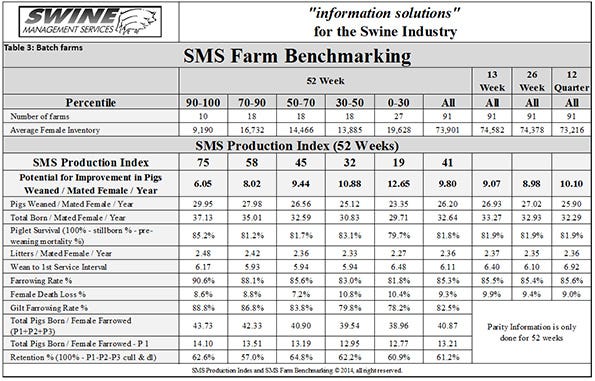
We plan next month to continue looking at batch farrowing and discuss in more detail some of the pluses and minuses of batch farming and share some ideas on how to improve performance. Do you see batch farrowing in your future?
SMS Production Index
Table 5 provides the 52-week rolling averages for 11 production numbers represented in the SMS Production Index. The numbers are separated by 90-100%, the 70-90%, the 50-70%, the 30-50% and the 0-30% groups. We also included the 13-week, 26-week and 12-quarter averages. These numbers represent what we feel are the key production numbers to look at to evaluate the farm’s performance.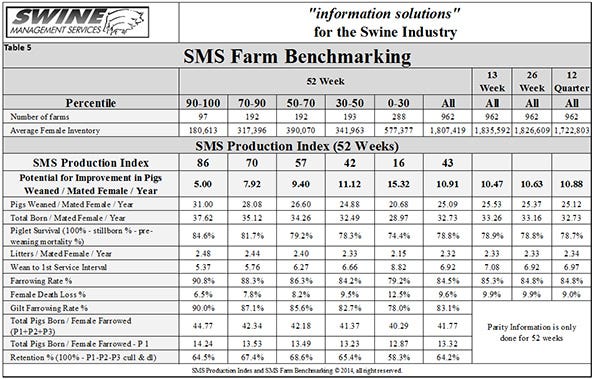
At SMS, our mission statement is to provide “Information solutions for the swine industry”. We feel with the creation of different SMS Benchmarking databases for all production areas we now have more detailed information to share with the swine industry. If your farm would like to be part of the SMS Benchmarking databases, or if you have suggestions on production areas to write articles about, please email us at [email protected] or [email protected]. We enjoy being a part of the National Hog Farmer Weekly Preview team. Previous Production Preview columns can be found at NationalHogFarmer.com.
You May Also Like
Enter a zip code to see the weather conditions for a different location.